Data and Statistics: Unit Study Guide
04.01 Data Analysis
Data and probability questions (about 5 of the 40) cover mean, median, mode and range, spread and outliers, reading tables and graphs, scatterplots, counting and basic and conditional probability. All arithmetic is done by hand.
Center and Spread
Mean, median and mode describe the center; range, IQR and standard deviation describe the spread.
| Mean | |
| Weighted mean | |
| Median | |
| Range | |
| IQR | |
| Outlier rule |
Mean absolute deviation
Method. MAD = average distance from the mean.
Worked example- First find the mean.
- So 55 ÷ 5 = 11.
- The distances from 11 are 12, 4, 5, 9, 4.
- Their sum is 34.
- So MAD = 34 ÷ 5 = 6.8.
- A (3.4): used only the distances above the mean
- B (6): measured distances from the median
- D (34): added the distances but did not divide
Interquartile range
Method. IQR = median of the upper half − median of the lower half.
Worked example- Order the values.
- So 7, 17, 21, 22, 26, 31, 33, 37.
- The lower half is 7, 17, 21, 22.
- So Q1 = 19.
- The upper half is 26, 31, 33, 37.
- So Q3 = 32.
- Then IQR = Q3 − Q1 = 32 − 19 = 13.
- A (5): used the median instead of Q3
- B (6.5): gave half the IQR
- C (8): used the median instead of Q1
Effect of outliers
Method. Find both means, then subtract; an outlier pulls the mean toward it.
Worked example- The mean with every value is 245 ÷ 7 = 35.
- The outlier is 119.
- Without it, the mean is 126 ÷ 6 = 21.
- The decrease is 35 − 21 = 14.
- A (2.5): found the change in the median
- B (12): used the original mean for the outlier's distance
- D (17): divided the outlier by the count
Comparing data sets
Method. Find the mean of each set separately, then subtract.
Worked example- Mean of A = 102 ÷ 5 = 20.4.
- Mean of B = 50 ÷ 5 = 10.
- The difference is 20.4 − 10 = 10.4.
- B (18): compared the medians instead
- C (30.4): added the means
- D (52): compared the sums
Missing value from a mean
Method. Needed score = target mean × new count − current total.
Worked example- For a mean of 88 over 6 tests, the total must be 88 × 6 = 528.
- The first 5 scores add to 430.
- So the next score must be 528 − 430 = 98.
- A (10): used the old number of tests
- B (88): gave the target mean
- C (90): averaged the old mean and the new score
Weighted mean
Method. Combined mean = total of all scores ÷ total count, not the average of the two means.
Worked example- Total for the first class is 8 × 69 = 552.
- Total for the second class is 12 × 80 = 960.
- The combined mean is (552 + 960) ÷ 20 = 75.6.
- A (73.4): matched each mean with the other group's size
- B (74.5): averaged the two means
- D (1512): gave the total, not the mean
Standard deviation (concept)
Method. Look for values bunched far from the center on both sides, not just one extreme value.
Worked example- Standard deviation measures how far values typically are from the mean.
- In Set S, the values sit farthest from their mean overall (SD ≈ 6.00).
- The other sets have smaller SDs: Set P ≈ 0.82, Set Q ≈ 2.16, Set R ≈ 5.09.
- So the answer is Set S.
- A (Set R): chose the set with the greatest range
- B (Set Q): chose the set with the greatest mean
- C (Set P): chose the set with the least spread
Distributions
Describe shape, center and spread. Box plots show the five-number summary, histograms show shape, and a long tail pulls the mean toward it, away from the median.
| Five-number summary | |
| Skew |
Five-number summary
Method. Sort, split into lower and upper halves, then take the median of each half.
Worked example- Order the values.
- So 2, 33, 34, 48, 61, 71, 74, 84, 88, 90.
- The lower half is 2, 33, 34, 48, 61.
- Its median is Q1 = 34.
- A (33): took the second value
- C (66): gave the median
- D (84): gave Q3 instead
Histograms
Method. Find the middle position, then add bar heights from the left until you pass it.
Worked example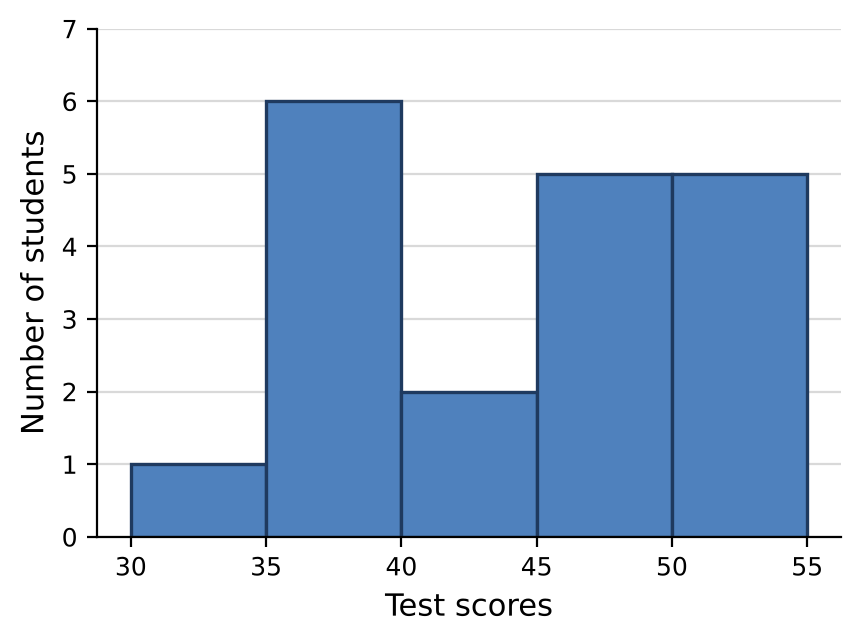
- With 19 values, the median is value number 10.
- The running totals of the bars are 1, 7, 9, 14, 19.
- The total first reaches 10 in the bar from 45 to 50.
- A (35 to 40): chose the tallest bar
- C (40 to 45): chose the middle interval on the scale
- D (50 to 55): miscounted the position of the middle value by a bar
Comparing distributions
Method. Read the same feature from both plots, then subtract.
Worked example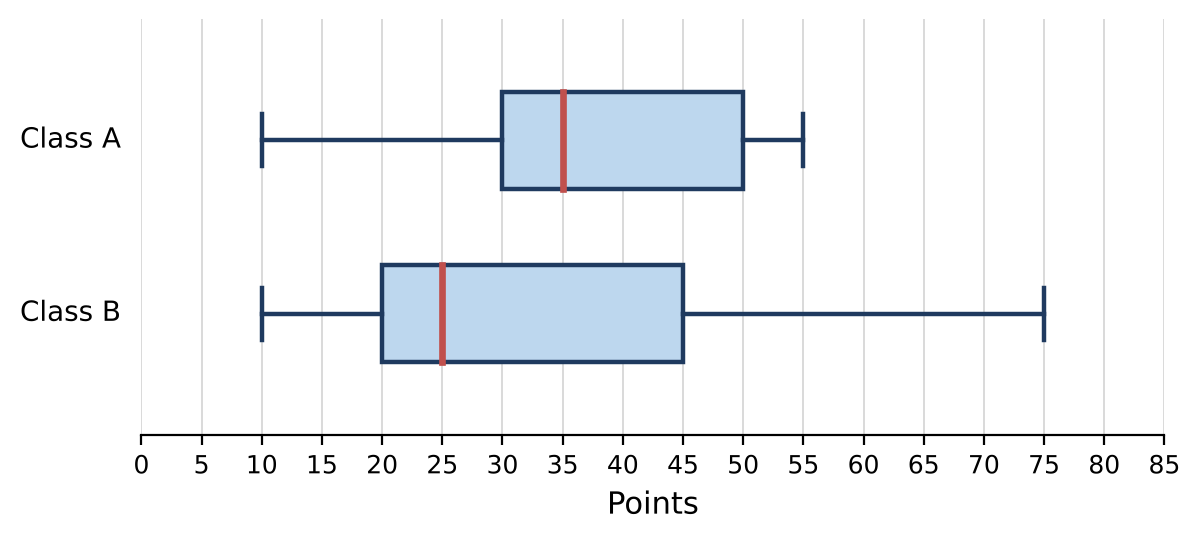
- The median of Class A is 35 and the median of Class B is 25.
- The difference is 35 − 25 = 10.
- A (−20): compared the maximums
- B (5): compared the Q3 values
- D (60): added the medians
Cumulative frequency
Method. Cumulative = running total; one interval's frequency = difference of consecutive totals.
Worked example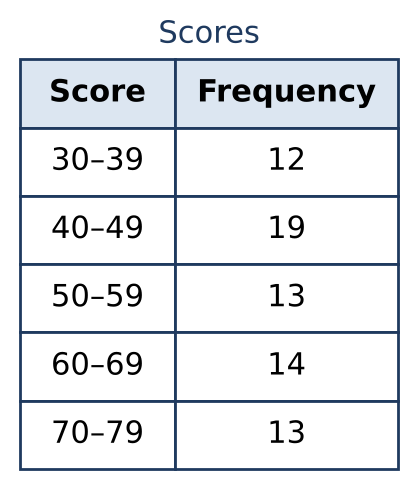
- Cumulative frequency adds every interval up to and including this one.
- So 12 + 19 = 31.
- A (12): stopped one interval early
- B (19): gave the frequency of that interval only
- D (44): went one interval too far
Percentiles
Method. Percent below = (number below ÷ total) × 100.
Worked example- Order the values.
- Exactly 12 values are less than 68.
- Out of 25 values, that is 12 ÷ 25 × 100 = 48%.
- A (12%): gave the count, not the percent
- C (50%): divided by one less than the count
- D (52%): counted the value itself as below it
Outliers (1.5 × IQR rule)
Method. Find both fences, then count the values outside them.
Worked example- Order the data and find Q1 = 24 and Q3 = 46.5.
- So IQR = 22.5.
- The fences are 24 − 33.75 = −9.75 and 46.5 + 33.75 = 80.25.
- The values outside the fences are 93.
- So there is 1 outlier.
- A (0): used 3 × IQR
- C (2): used 1 × IQR instead of 1.5 × IQR
- D (3): counted every value above Q3
Graphs and Tables
Read the title, axes and scale before reading values. Bar graphs compare categories, line graphs show change over time, circle graphs show parts of a whole.
| Percent of whole | |
| Central angle |
Circle graphs
Method. Number = percent × total ÷ 100.
Worked example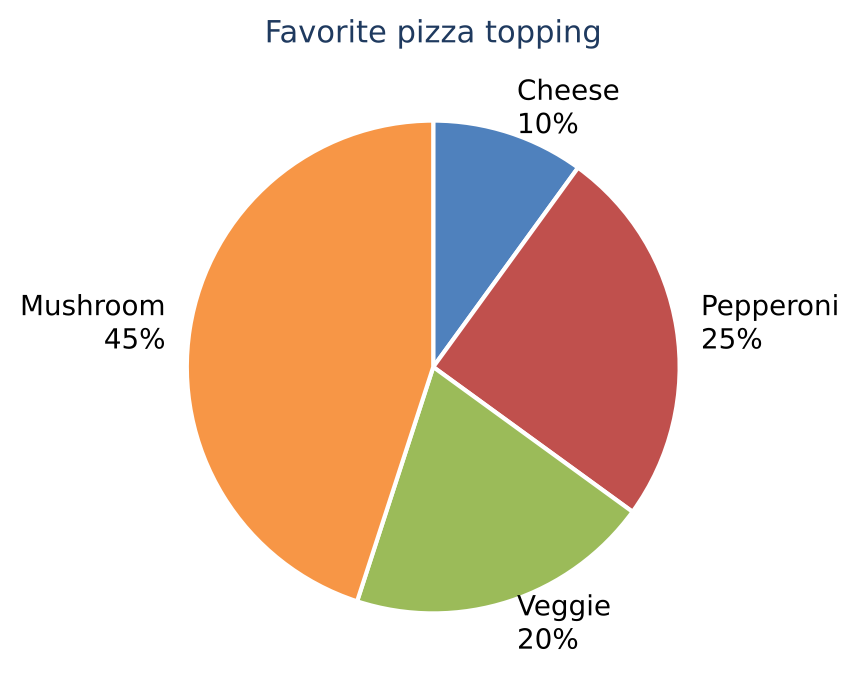
- The percents differ by 25% − 20% = 5%.
- Then 5% of 60 is × 60 = 3.
- B (5): subtracted the percents but did not find them of the total
- C (15): gave the number for Pepperoni only
- D (27): added instead of subtracting
Two-way tables
Method. Given a row → divide by that row's total.
Worked example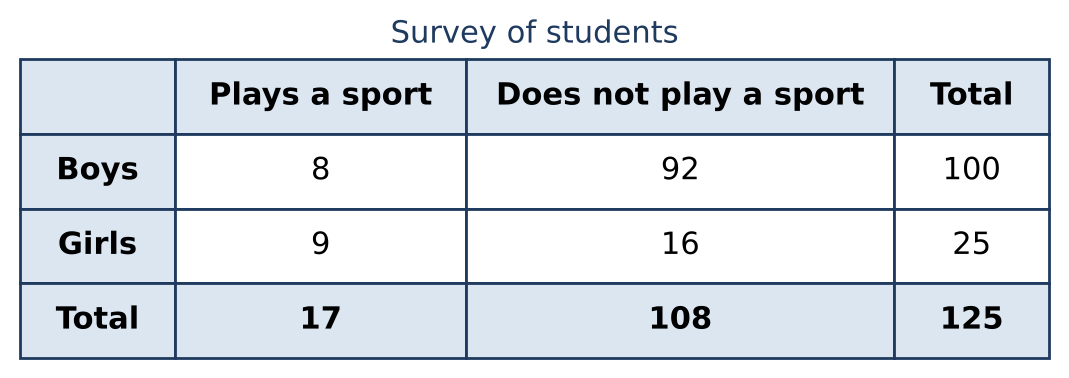
- The question is about the Boys row only.
- So divide by its total, 100.
- Then 8 ÷ 100 = = 8%.
- B (36%): used the Girls row
- C (80%): found the percent of all students in the Boys row
- D (92%): used the Does not play a sport cell
Line graphs
Method. Percent change = (new − old) ÷ old × 100; always divide by the earlier year.
Worked example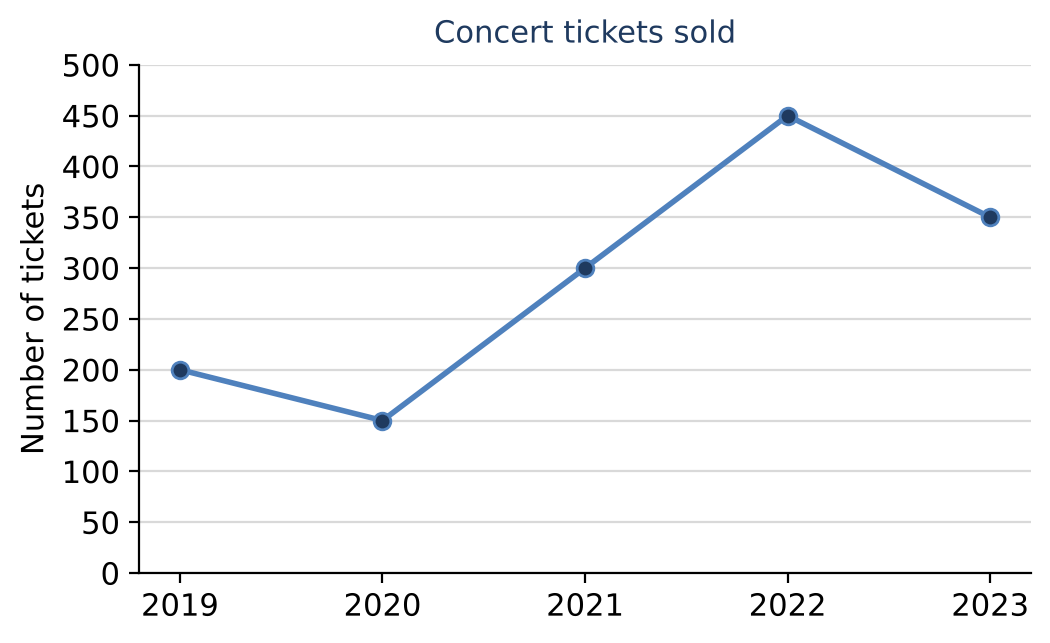
- Read the graph.
- So 2020 = 150 and 2021 = 300.
- The change is 150.
- Percent increase = change ÷ original × 100 = 150 ÷ 150 × 100 = 100%.
- A (50%): divided by the new value instead of the original
- C (150%): gave the change, not the percent change
- D (200%): gave the new value as a percent of the original
Bar graphs
Method. Percent change = (new − old) ÷ old × 100; always divide by the earlier year.
Worked example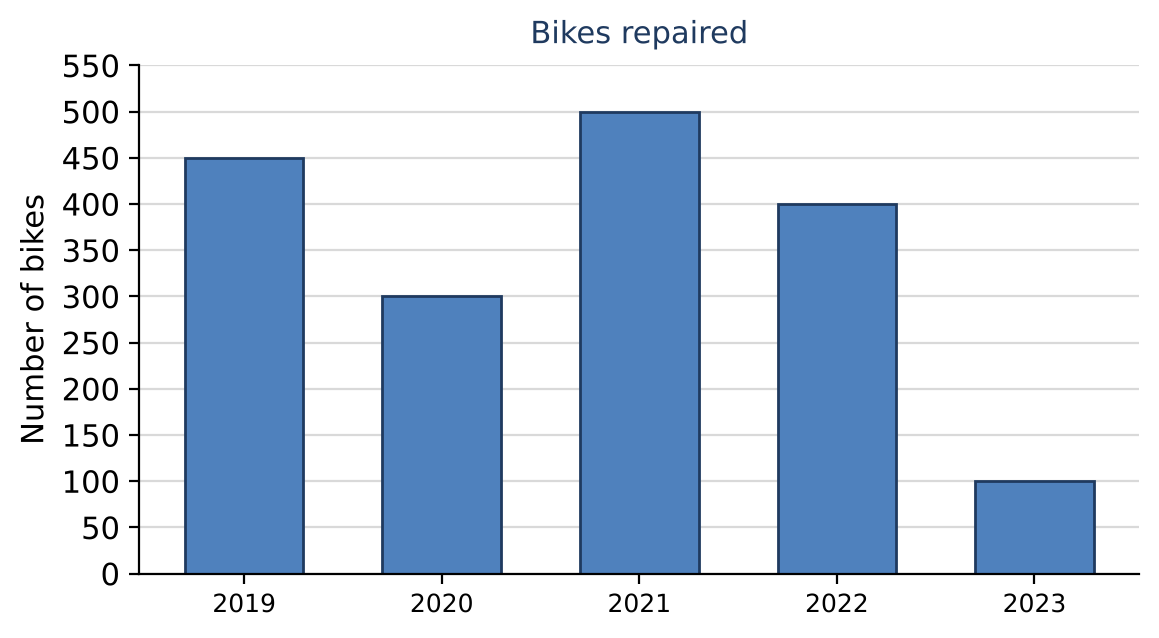
- Read the graph.
- So 2021 = 500 and 2023 = 100.
- The change is 400.
- Percent decrease = change ÷ original × 100 = 400 ÷ 500 × 100 = 80%.
- A (20%): gave the new value as a percent of the original
- C (400%): divided by the new value instead of the original
- D (500%): gave the original value as a percent of the new value
Misleading graphs
Method. Read values on the scale; a cut axis makes the bars' heights misleading.
Worked example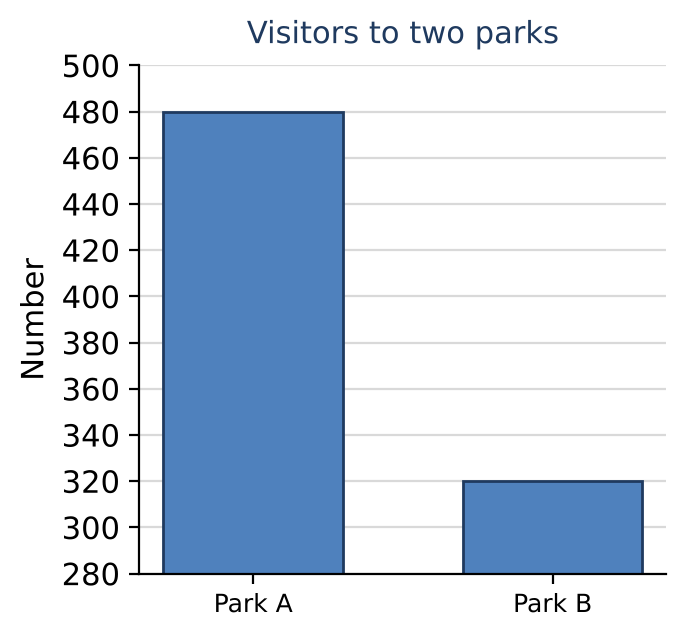
- Each bar's drawn height starts at 280.
- Park A's bar is 480 − 280 = 200 tall and Park B's is 320 − 280 = 40 tall.
- So it looks 200 ÷ 40 = 5 times as tall.
- A (): subtracted the starting value from one bar only
- B (): used the actual values instead of the bar heights
- D (160): found the difference instead of a ratio
Building data displays
Method. Angle = (part ÷ total) × 360°.
Worked example- The total is 24 + 18 + 5 + 13 = 60.
- Apples is of the data.
- The angle is × 360° = 144°.
- A (24): gave the count
- B (40): found the percent instead of the angle
- C (90): split the circle equally
Scatterplots and Lines of Fit
Describe direction, form and strength. A line of fit predicts y from x; r near ±1 means a strong linear relationship.
| Line of fit | |
| Residual |
Interpreting a line of fit
Method. Slope = predicted change per 1 unit of x; intercept = prediction at x = 0.
Worked example- The slope is the predicted change in y for a 1-unit increase in x.
- It describes a trend in predictions, not an exact or causal rule.
- So the slope means “For each additional unit of temperature in °F, the predicted number of drinks sold increases by 5.5”.
- A (When temperature in °F is 0, the predicted number of drinks sold is 51.): described the intercept instead of the slope
- C (For each additional unit of number of drinks sold, the predicted temperature in °F increases by 5.5.): reversed the roles of x and y
- D (Every individual's number of drinks sold increases by exactly 5.5 for each unit of temperature in °F.): treated the prediction as exact for every individual
Linear and exponential models
Method. Raise the base to the power first, then multiply by the starting value.
Worked example- Substitute x = 3.
- Then ŷ = 50 × = 50 × 27 = 1350.
- A (77): added a instead of multiplying
- B (450): multiplied by x instead of raising to the power x
- D (4050): used one power too many
Probability
Probability is favorable outcomes over equally likely total outcomes. Use the addition rule for "or"; for "and", multiply the probabilities when the events are independent, and use conditional probability when they are not.
| Basic | |
| Complement | |
| Addition | |
| Independent | |
| Conditional |
Compound events
Method. Independent “and” → multiply the probabilities.
Worked example- The two results are independent.
- So multiply.
- P(a vowel) = and P(blue) = .
- So P(both) = × = .
- B (): used only the first event
- C (): doubled the product
- D (): used only the second event
Addition rule
Method. Add the two probabilities, then subtract the overlap once.
Worked example- Add P(A) and P(B).
- Then subtract the overlap P(A and B) once.
- So 0.65 + 0.55 − 0.4 = 0.8.
- A (0.2): found the probability of neither
- B (0.3575): multiplied the probabilities
- C (0.4): subtracted the overlap twice
Expected counts
Method. Expected count = probability × number of spins.
Worked example- P(purple) = = .
- Multiply by the number of spins.
- So × 252 = 84.
- B (112): used the blue sections
- C (168): found the expected number of non-purple results
- D (1512): multiplied by the count of sections instead of the probability
Conditional probability and two-way tables
Method. “Given” or “from those in” → divide by that group's total; “and” → one cell ÷ grand total.
Worked example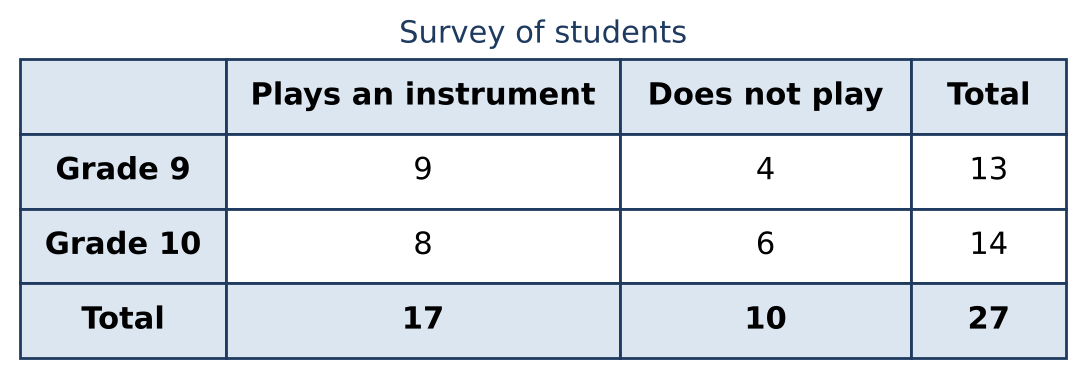
- The cell for Grade 10 and Does not play has 6 people out of 27 in all.
- So the probability is = .
- A (): multiplied the separate probabilities
- C (): divided by the Grade 10 row total
- D (): divided by the Does not play column total
Complement rule
Method. P(at least one) = 1 − P(none).
Worked example- “At least one” is the complement of “none”.
- P(none) = = = .
- So P(at least one) = 1 − = .
- A (): found the probability that all succeed
- B (): used only one try
- D (): multiplied the probability by the number of tries
Independence
Method. Independent: P(A and B) = P(A)P(B); then use the addition rule.
Worked example- Because A and B are independent, P(A and B) = 0.6 × 0.6 = 0.36.
- Then P(A or B) = 0.6 + 0.6 − 0.36 = 0.84.
- A (0.16): found the probability of neither
- B (0.36): gave P(A and B)
- C (0.48): found exactly one of the events
Conditional probability formula
Method. P(A | B) = P(A and B) ÷ P(B): divide by the probability of the given event.
Worked example- P(A | B) means divide P(A and B) by P(B).
- So 0.05 ÷ 0.65 = .
- A (): multiplied instead of dividing
- B (): gave P(A and B)
- D (): divided by P(A) instead of P(B)
Counting
Multiply choices for each stage. Use permutations when order matters and combinations when it does not.
| Counting principle | |
| Factorial | |
| Permutations | |
| Combinations | |
| Expected value |
Counting principle
Method. Multiply the number of choices for each independent step.
Worked example- Each of the 3 positions has 10 choices, and the choices are independent.
- By the counting principle, 10 × 10 × 10 = = 1000.
- A (30): multiplied the number of digits by the length
- B (100): used one position too few
- C (720): did not allow repeated digits
Sample spaces and tree diagrams
Method. Count ordered pairs out of 36.
Worked example- There are 6 × 6 = 36 equally likely ordered outcomes, and only 1 of them, (6, 6), has sum 12.
- So the probability is .
- B (): divided by 12 instead of 36
- C (): treated the 11 sums as equally likely
- D (): divided by 6 instead of 36
Combinations
Method. No roles, just a group → order does not matter → nCr = nPr ÷ r!.
Worked example- Order does not matter.
- So use combinations.
- C(10, 3) = 10! ÷ (3! × 7!) = 720 ÷ 6 = 120.
- A (45): chose one too few
- C (720): counted different orders as different
- D (1000): allowed repeats and order
Expected value
Method. E = Σ (payoff × probability); losses are negative.
Worked example- Multiply each payoff by its probability and add.
- Win: 90 × = 36.
- Lose: −4 × = −2.4.
- Total 36 − 2.4 = 33.6.
- So the expected value is $33.60 per play.
- A ($36.00): ignored the loss
- B ($34.40): used the winning probability for the loss too
- C ($86.00): ignored the probabilities
Permutations
Method. Different roles → order matters → nPr.
Worked example- The roles are different.
- So order matters.
- That is 7P2 = 7 × 6 = 42.
- A (7): filled one role too few
- B (14): multiplied n by r
- C (21): ignored the order (used combinations)
Binomial probability
Method. P(X = k) = C(n, k)·pᵏ·ᵏ.
Worked example- This is binomial with n = 6 and p = .
- P(X = 4) = C(6, 4) = 15 × × = .
- A (): left out the number of arrangements C(n, k)
- C (): left out the failure factor
- D (): swapped the success and failure probabilities