Quantitative Reasoning: Unit Study Guide
02.01 Word Problems
The Middle Level ISEE (students in grades 6–7 applying to grades 7–8) has a 37-question Quantitative Reasoning section in 35 minutes: about 20 word problems followed by about 17 quantitative comparisons, four answer choices and no calculator. There is no penalty for a wrong answer, so answer every question. This topic covers word problems that test reasoning more than computation: money, time, rates and work, ratios and proportions, unit conversions, percents, graphs and tables, probability, and mean, median, mode and range.
Word Problems
Name the unknown, translate the words into an equation, solve, and answer the question that was asked, with units.
Key formulas| Distance | |
| Moving toward each other | |
| Consecutive integers | |
| Working together | |
| Making change |
Unit price
Method. Find the cost of one, then multiply.
Worked example- Price of one: $37.05 ÷ 3 = $12.35.
- Cost of 8: 8 × $12.35 = $98.80.
- A ($12.35): gave the price of one notebook
- B ($37.05): gave the cost of 3 notebooks
- D ($296.40): multiplied the cost of 3 by 8
Consecutive integers
Method. The middle (average) is 78 ÷ 3; step out from the middle.
Worked example- Let the smallest be n.
- The 3 consecutive integers are n, n + 1, n + 2.
- Their sum: 3n + 3 = 78.
- Subtract 3: 3n = 75.
- Divide: n = 25.
- The smallest is 25.
- A (24): counted one step too far
- C (26): gave the average (middle value)
- D (27): gave the largest number
Distance, rate and time
Method. Distance = rate × time; opposite directions or toward each other → add speeds, same direction → subtract.
Worked example- Moving apart, the distance grows at 34 + 44 = 78 miles per hour.
- Time = distance ÷ rate: 156 ÷ 78 = 2 hours.
- A (1): doubled the sum of the speeds
- C (4): divided by the average speed instead of the sum of the speeds
- D (15.6): subtracted the speeds instead of adding
Averages
Method. New score = new average + (number of old tests) × (rise in average) = 76 + 3 × 1.
Worked example- Current total: 3 × 75 = 225.
- Needed total for 4 tests: 4 × 76 = 304.
- Next score: 304 − 225 = 79.
- A (4): multiplied the gap by 4
- B (76): gave the target average
- C (77): averaged the old average and the new score only
Age problems
Method. Add the same number of years to BOTH ages before setting up the multiple.
Worked example- Let Ben's age now be b.
- So Jake is 4b.
- In 10 years: 4b + 10 = 3(b + 10).
- Expand: 4b + 10 = 3b + 30.
- Subtract 3b and 10: b = 20.
- B (30): gave Ben's age in 10 years
- C (80): gave Jake's age instead of Ben's
- D (90): gave Jake's age in 10 years
Work problems
Method. Together time = (product)/(sum) of the two times.
Worked example- Tom does of the job per hour and Ben does .
- Together: + = of the job per hour.
- Time = 1 ÷ = 3 hours.
- A (): gave the combined rate (jobs per hour) instead of the time
- C (8): averaged the two times
- D (16): added the two times
Ratios, Rates and Proportions
A ratio compares two quantities; a proportion sets two ratios equal and is solved by cross-multiplying. A unit rate is the amount for one unit. Convert units by multiplying by a fraction equal to 1, and remember that square units use the conversion squared.
Key formulas| Proportion | |
| Unit rate | |
| Proportional relationship | |
| Scale | |
| Unit conversion | |
| Square units | |
| Density |
Simplify a ratio
Method. Divide both terms by any common factor and repeat until 1 is the only common factor; keep the order.
Worked example- Divide both terms by their greatest common factor, 6: 12 ÷ 6 = 2 and 30 ÷ 6 = 5.
- So 12:30 = 2:5.
- A (5:2): reversed the order of the ratio
- B (4:10): divided by a common factor that is not the greatest, so it is not in simplest form
- C (2:7): wrote the first part to the total instead of to the second part
Ratios in context
Method. Write the two counts in the order asked, then simplify.
Worked example- First find the number of red marbles: 32 − 28 = 4.
- The ratio of red marbles to blue marbles is 4:28.
- Divide both by 4: 1:7.
- B (7:1): reversed the order of the ratio
- C (1:8): compared red marbles to all marbles
- D (7:8): compared blue marbles to all marbles
Proportional relationships — find a value
Method. Set up equal ratios: = , so y = 21 × 2 ÷ 3 = 14.
Worked example- Proportional means y = kx.
- Find k: k = y ÷ x = 21 ÷ 3 = 7.
- Then y = 7 × 2 = 14.
- A (7): gave the constant of proportionality instead of y
- C (20): added the same amount to y as was added to x
- D (42): multiplied the first y-value by the new x-value
Proportional relationships — constant from a graph
Method. Read any labelled point (x, y) on the line and divide y by x.
Worked example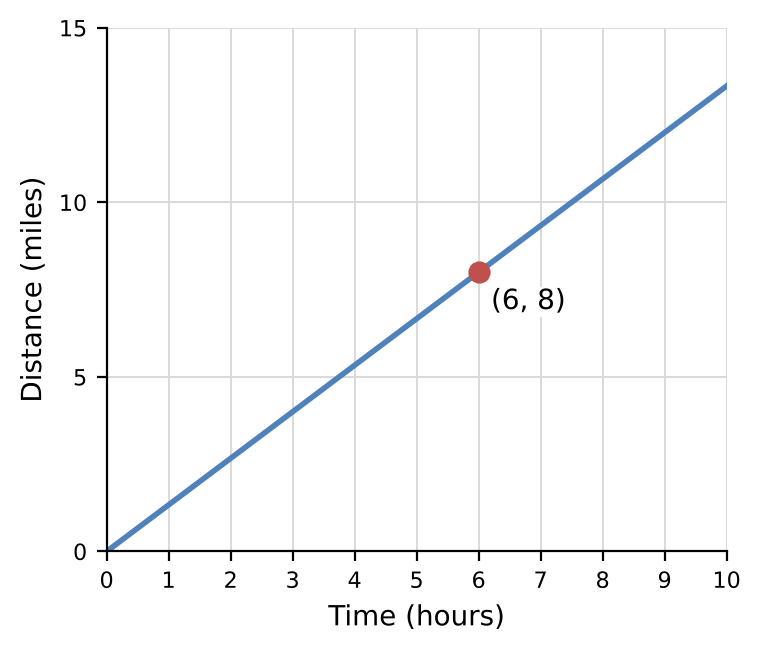
- The line passes through the origin and the point (6, 8).
- k = y ÷ x = 8 ÷ 6 = .
- A (): divided x by y instead of y by x
- C (2): subtracted the coordinates
- D (8): gave the y-value of the point
Scale drawings and maps
Method. Map → real: multiply by the scale; real → map: divide by the scale.
Worked example- Each centimeter stands for 25 km.
- So multiply: 8.4 × 25 = 210 km.
- A (0.336): divided by the scale instead of multiplying
- B (21): dropped a zero from the answer
- C (33.4): added the scale to the map distance
Speed — find the distance
Method. Distance = speed × time; convert the minutes to hours first (30 min = 0.5 h).
Worked example- 30 minutes = = 0.5 hour.
- So the time is 1.5 hours.
- Distance = speed × time = 72 × 1.5 = 108 miles.
- A (72): ignored the minutes
- B (93.6): treated 1 hour 30 minutes as 1.30 hours
- D (2,232): added the minutes as if they were hours
Unit rates — better buy
Method. Divide price by size for every choice and compare; ignore the total price.
Worked example- Find each price per lb: $1.82 ÷ 2 ≈ $0.910.
- $8.71 ÷ 13 ≈ $0.670.
- $8.61 ÷ 3 ≈ $2.870.
- $30.24 ÷ 16 ≈ $1.890.
- The lowest is 13 lb for $8.71.
- A (2 lb for $1.82): chose the lowest total price instead of the lowest price per unit
- B (16 lb for $30.24): chose the largest package without comparing unit prices
- D (3 lb for $8.61): chose the highest price per unit
Unit conversions with square and cubic units
Method. Square units use the factor squared ; cubic units use it cubed .
Worked example- One square yard is 3 × 3 = 9 square feet, because every dimension is converted.
- So 6 square yards = 6 × 9 = 54 square feet.
- A (): divided instead of multiplying
- B (18): multiplied by the length factor 3 only
- D (162): used the cubic factor instead of the square factor
Density
Method. Density = mass ÷ volume; check by multiplying density × volume to get the mass.
Worked example- Density = mass ÷ volume.
- Density = 10.5 ÷ 7.
- So Density = 1.5 grams per cubic centimeter.
- A (0.15): misplaced the decimal point in the quotient: 0.15 instead of 1.5
- C (3.5): subtracted volume from mass
- D (73.5): multiplied mass by volume
Percents
Percent means per hundred. Change the percent to a fraction or decimal, then multiply. Discounts and markups change a price by a percent of the original; percent change compares the change with the original amount.
Key formulas| Fraction, decimal, percent | |
| Percent of | |
| Find the percent | |
| Find the whole | |
| Discount | |
| Tax, tip or markup | |
| Percent change | |
| Simple interest |
Fraction to percent
Method. Scale the fraction to a denominator of 100 if you can: = = 20%.
Worked example- Divide to get a decimal.
- Then multiply by 100: 1 ÷ 5 = 0.2, and 0.2 × 100 = 20%.
- A (0.2%): wrote the decimal as the percent (did not multiply by 100)
- B (1.5%): put a decimal point between the top and bottom numbers
- D (80%): used the other part (100% minus the answer)
Find the percent
Method. Write the fraction and scale it to a denominator of 100.
Worked example- Percent = part ÷ whole × 100.
- Percent = 78 ÷ 130 × 100 = 0.6 × 100.
- So Percent = 60%.
- A (0.6%): did not multiply by 100
- B (40%): found the percent that is left over
- C (52%): subtracted the part from the whole
Percent of a number
Method. Split the percent into easy parts (10%, 5%, 1%): 12.5% of 320 = 40.
Worked example- 12.5% means 12.5 per 100.
- So multiply by 0.125: 0.125 × 320 = 40.
- B (280): found the amount left after taking the percent
- C (332.5): added the percent to the number
- D (400): moved the decimal point one place too far right
Percent to fraction (simplest form)
Method. Write the percent over 100, clear any decimal, then simplify.
Worked example- 37.5% = = .
- This simplifies to .
- B (): did not simplify the fraction
- C (): used the other part (100% minus the percent)
- D (): used 10 as the bottom number instead of 100
Discounts and sale prices
Method. Pay 65% of the price: 0.65 × $120.00 = $78.00.
Worked example- Discount = 35% of $120.00 = $42.00.
- Sale price = $120.00 − $42.00 = $78.00.
- B ($85.00): subtracted 35 dollars instead of 35%
- C ($119.65): subtracted the percent as a decimal
- D ($162.00): added the discount instead of subtracting
Markup
Method. Multiply the cost by 1.45: $855.50.
Worked example- Markup = 45% of $590.00 = $265.50.
- Selling price = $590.00 + $265.50 = $855.50.
- A ($265.50): gave the markup only, not the selling price
- B ($324.50): subtracted the markup instead of adding it
- C ($635.00): added 45 dollars instead of 45%
Tax and tips
Method. Multiply by 1.15 (115%) in one step: 1.15 × $28.00 = $32.20.
Worked example- Sales tax = 15% of $28.00 = 0.15 × $28.00 = $4.20.
- Total = $28.00 + $4.20 = $32.20.
- A ($4.20): gave the sales tax only, not the total
- B ($23.80): subtracted the sales tax instead of adding it
- C ($28.15): added the percent as a decimal
Percent increase and decrease
Method. New ÷ original = 1.45, so the change is 1.45 − 1 = +0.45 → 45%.
Worked example- Change = $348.00 − $240.00 = $108.00.
- Percent change = change ÷ original × 100 = 108 ÷ 240 × 100 = 45%.
- A (0.45%): did not multiply by 100
- C (108%): gave the amount of change as the percent
- D (145%): gave the new value as a percent of the original
Simple interest
Method. One year's interest is $117.00; multiply by 4 years.
Worked example- Simple interest I = P × r × t.
- Simple interest I = $3,900 × 0.03 × 4.
- So Simple interest I = $468.00.
- B ($4,368.00): gave the total amount instead of the interest
- C ($4,680.00): moved the decimal point one place too far right in the rate
- D ($46,800.00): used the percent without dividing by 100
Graphs and Tables
Read the title, axes, scale and units before reading values. Bar graphs compare categories, line graphs show change over time, circle graphs show parts of a whole, and dot plots, stem-and-leaf plots and histograms show how data are spread.
Key formulas| Circle graph | |
| Change | |
| Stem-and-leaf | |
| Two-way table |
Line graphs
Method. Read both points on the scale, then subtract the smaller from the larger.
Worked example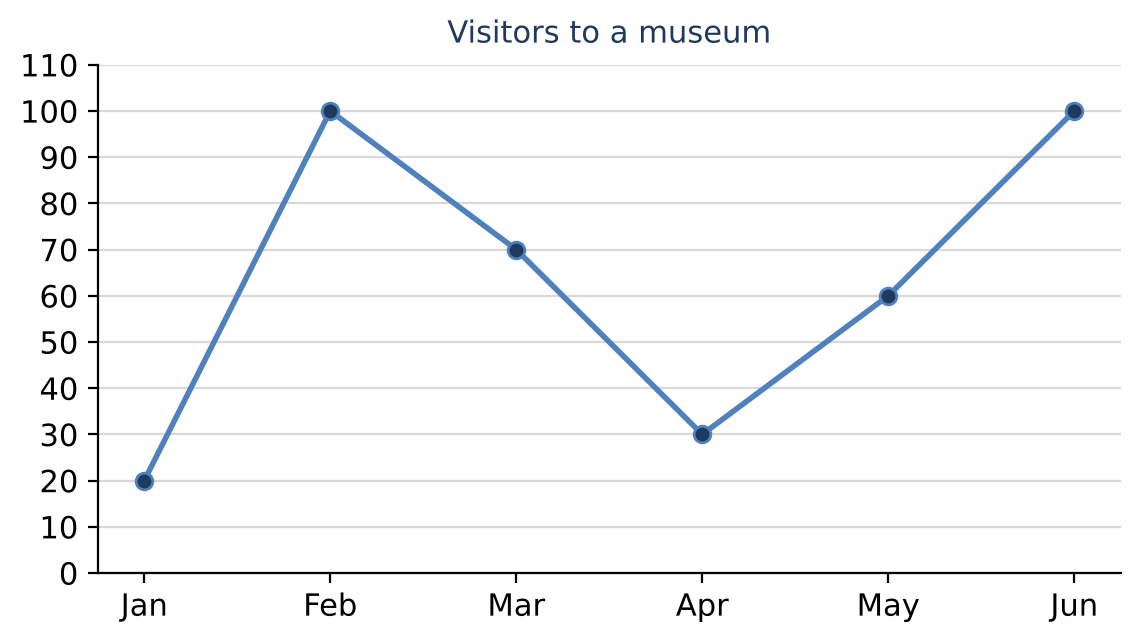
- Read the points.
- So February = 100 and March = 70.
- The decrease is 100 − 70 = 30.
- A (20): misread one point by one grid line the other way
- C (70): gave the March value
- D (100): gave the February value
Circle graphs
Method. Number = percent × total ÷ 100.
Worked example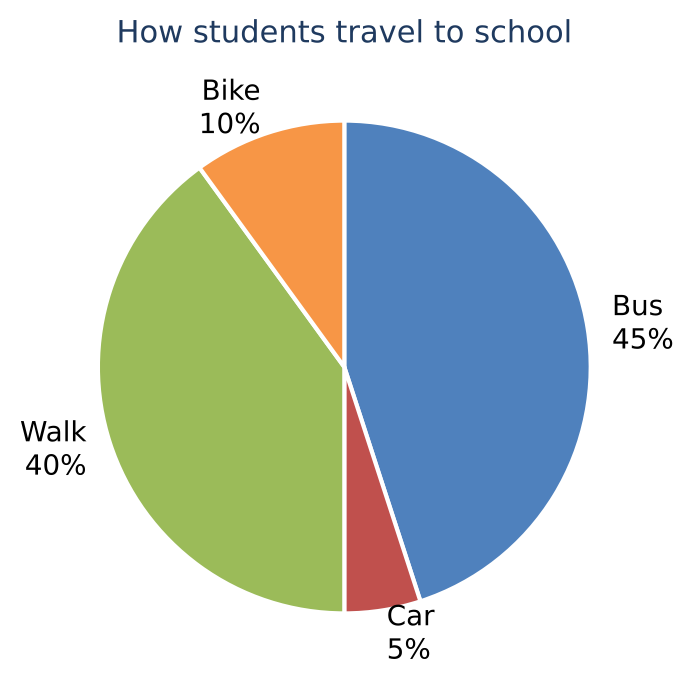
- Walk is 40% of the circle.
- Find 40% of 240.
- So × 240 = 96.
- A (12): used the percent for Car
- B (40): gave the percent instead of the number
- C (60): split the total equally
Stem-and-leaf plots
Method. Count the leaves after 71 in its row, then every leaf below that row.
Worked example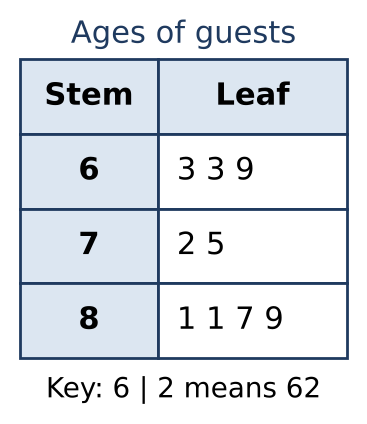
- In the row with stem 7, the leaves greater than 1 give 2 values.
- Every value in the rows below it is greater, adding 4 more.
- So there are 6 values.
- A (2): counted only the row with stem 7
- B (3): counted the values below
- C (4): counted only the rows below the one with stem 7
Building data displays
Method. Tally each value into its interval; the bar height is the tally.
Worked example- Find the scores from 50 to 59, which are 50, 51, 52, 56, 58.
- That is 5 scores.
- So the bar is 5 tall.
- A (2): counted the next interval
- C (6): also counted 60
- D (7): counted the values outside the interval
Histograms
Method. Add the heights of the bars from 40 onward.
Worked example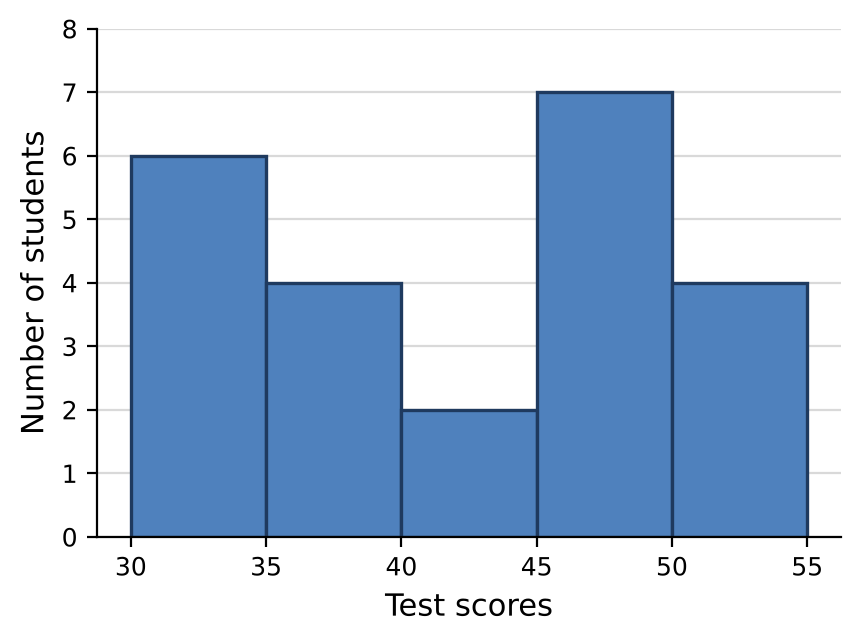
- At least 40 starts with the bar 40–45.
- Add that bar and every bar to its right.
- So 2 + 7 + 4 = 13.
- A (2): used only one bar
- C (17): started one bar too early
- D (23): counted every bar
Two-way tables
Method. Add the two row totals; together they cover every cell.
Worked example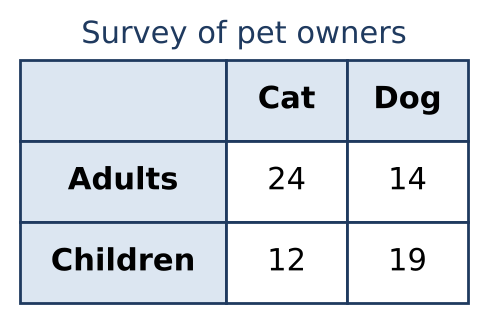
- Every pet owner is in exactly one cell.
- Add all four cells.
- So 24 + 14 + 12 + 19 = 69.
- A (36): added only the Cat column
- B (38): added only the Adults row
- D (79): made a carrying error of 10
Probability
Probability is the number of favorable outcomes over the number of equally likely outcomes; it is between 0 and 1. Count outcomes by listing or by multiplying the choices at each step. The expected count is the probability times the number of trials.
Key formulas| Basic | |
| Range of values | |
| Complement | |
| Counting principle | |
| Independent events | |
| Expected count |
Experimental and theoretical probability
Method. Expected count = probability × number of trials.
Worked example- Multiply the probability by the number of trials.
- So × 20 = 15.
- A (): gave the probability, not a count
- B (5): found the expected count of the other outcome
- D (16): added one
Sample spaces and counting
Method. Multiply the number of choices for each independent step.
Worked example- By the counting principle, multiply the number of choices.
- 2 × 4 = 8.
- A (6): added instead of multiplying
- B (7): subtracted one
- D (9): added one extra outfit
Compound events
Method. Independent “and” → multiply the probabilities.
Worked example- The two results are independent.
- So multiply.
- P(heads) = and P(green) = .
- So P(both) = × = .
- B (): used only the second event
- C (): used only the first event
- D (): added the probabilities
Mean, Median, Mode and Range
The mean, median and mode describe the center of a data set; the range (greatest minus least) and the mean absolute deviation (MAD) describe how spread out it is. An outlier pulls the mean toward it but barely moves the median.
Key formulas| Mean | |
| Sum from the mean | |
| Median | |
| Median (even count) | |
| Mode | |
| Range | |
| Mean absolute deviation | |
| Add k to every value |
Mean
Method. Mean = sum of the values ÷ how many values there are.
Worked example- Add the values.
- So 23 + 6 + 24 + 3 = 56.
- Divide by the number of values, 4.
- So the mean is 56 ÷ 4 = 14.
- A (11.2): divided by one more than the count
- C (14.5): gave the median
- D (56): found the sum but did not divide
Median
Method. Count to the middle dot (or the middle two) from the left.
Worked example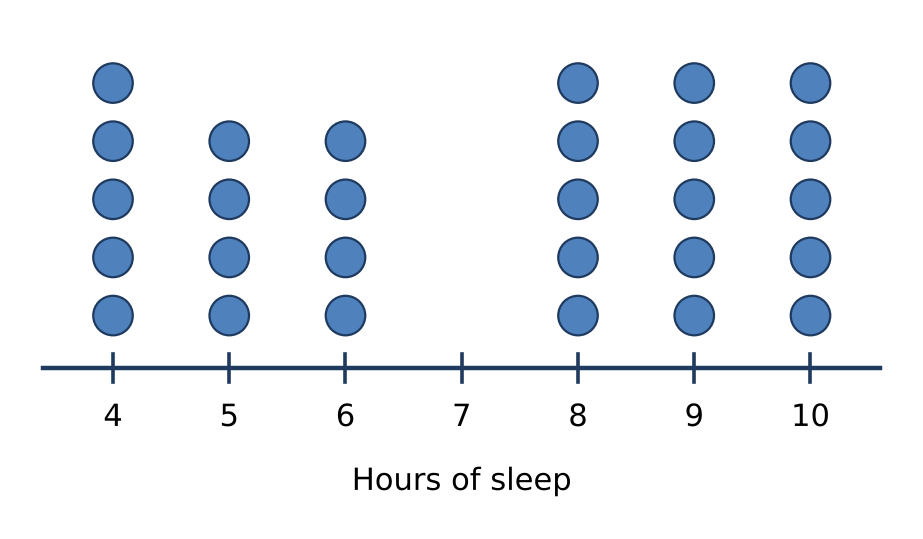
- There are 28 dots in all.
- The median is the mean of the values in positions 14 and 15, counting from the left.
- Those values are 8 and 8.
- So the median is (8 + 8) ÷ 2 = 8.
- A (5): gave the number of dots in the tallest column
- B (7): gave the middle of the number line
- D (14.5): gave the middle position instead of the value
Effect of outliers
Method. Find both means, then subtract; an outlier pulls the mean toward it.
Worked example- The mean with every value is 205 ÷ 5 = 41.
- The outlier is 129.
- Without it, the mean is 76 ÷ 4 = 19.
- The decrease is 41 − 19 = 22.
- A (1.5): found the change in the median
- B (17.6): divided the outlier's distance from the original mean by the original count: (129 − 41) ÷ 5 = 17.6
- C (19): gave the new mean
Comparing data sets
Method. Find the median of each set separately, then subtract.
Worked example- Ordered, A is 8, 42, 51, 54, 56, 71.
- So its median is 52.5.
- Ordered, B is 4, 9, 21, 58, 70, 72.
- So its median is 39.5.
- The difference is 52.5 − 39.5 = 13.
- A (−5): compared the ranges
- B (−1): compared the greatest values
- C (8): compared the means instead
Mean absolute deviation
Method. MAD = average distance from the mean.
Worked example- First find the mean.
- So 52 ÷ 4 = 13.
- The distances from 13 are 1, 5, 8, 2.
- Their sum is 16.
- So MAD = 16 ÷ 4 = 4.
- A (2): used only the distances above the mean
- B (3.2): divided by one more than the count
- C (3.5): measured distances from the median
02.02 Quantitative Comparisons
The Middle Level ISEE (students in grades 6–7 applying to grades 7–8) has a 37-question Quantitative Reasoning section in 35 minutes: about 20 word problems followed by about 17 quantitative comparisons, four answer choices and no calculator. There is no penalty for a wrong answer, so answer every question. Each quantitative comparison gives two quantities, one in Column A and one in Column B (with any information about them centered above). Choose (A) if the quantity in Column A is greater, (B) if the quantity in Column B is greater, (C) if the two quantities are equal, and (D) if the relationship cannot be determined from the information given.
Quantitative Comparisons
Compare Column A with Column B without always computing both exactly: simplify, estimate, or change both columns the same way. When a variable is involved, test several allowed values (a positive whole number, a fraction between 0 and 1, zero or a negative number if allowed); if different values give different results, the answer is (D).
Key formulas| Choose (A) | |
| Choose (B) | |
| Choose (C) | |
| Choose (D) | |
| Same change to both | |
| Multiplying by a negative | |
| Test special values |
value of a digit
Method. Hundreds place means × 100, and = 100.
Worked example| Column A | Column B |
|---|---|
| the value of the digit 7 in 3,742.5 | 7 × |
- In 3,742.5 the digit 7 is in the hundreds place, so its value is 700.
- 7 × = 7 × 100 = 700.
- The two quantities are equal.
- A (The quantity in Column A is greater.): Reads the 7 as being in the thousands place and uses 7,000.
- B (The quantity in Column B is greater.): Reads the 7 as being in the tens place and uses 70.
- D (The relationship cannot be determined from the information given.): Thinks a digit's value cannot be compared with a power-of-ten expression.
decimal multiplication
Method. Multiply the digits, then count the total decimal places.
Worked example| Column A | Column B |
|---|---|
| 0.3 × 0.2 | 0.06 |
- 3 × 2 = 6, and the factors have 1 + 1 = 2 decimal places in all.
- So 0.3 × 0.2 = 0.06.
- The two quantities are equal.
- A (The quantity in Column A is greater.): Keeps only one decimal place and gets 0.3 × 0.2 = 0.6.
- B (The quantity in Column B is greater.): Puts in one decimal place too many and gets 0.006.
- D (The relationship cannot be determined from the information given.): Thinks a product of decimals cannot be found exactly without a calculator.
unit price scaling
Method. 12 pencils = 2 × 5 pencils + 2 pencils = $2.40 + $0.48 = $2.88.
Worked example| Column A | Column B |
|---|---|
| the cost of 12 pencils | $2.40 |
- One pencil costs $1.20 ÷ 5 = $0.24.
- 12 pencils cost 12 × $0.24 = $2.88.
- $2.88 > $2.40, so Column A is greater.
- B (The quantity in Column B is greater.): sets up the proportion upside down: $1.20 × 5 ÷ 12 = $0.50
- C (The two quantities are equal.): multiplies $1.20 by 2 for 10 pencils and forgets the other 2: $2.40
- D (The relationship cannot be determined from the information given.): thinks a bulk discount could change the price
two-step inequality bound
Method. x < 5 allows numbers on both sides of 4.
Worked example| Column A | Column B |
|---|---|
| x | 4 |
- Add 3: 2x < 10. Divide by 2: x < 5.
- x = 3 is allowed and gives 3 < 4 (Column B greater).
- x = 4.5 is allowed and gives 4.5 > 4 (Column A greater). The relationship cannot be determined.
- A (The quantity in Column A is greater.): solves 2x − 3 = 7 to get x = 5 and treats x as 5
- B (The quantity in Column B is greater.): thinks the largest whole number allowed is 4, so x ≤ 4, and tests x = 3
- C (The two quantities are equal.): thinks x < 5 means x is 4, the integer just below 5
Angles around a point
Method. (360 − 210) ÷ 2 = 75.
Worked example| Column A | Column B |
|---|---|
| x | 80 |
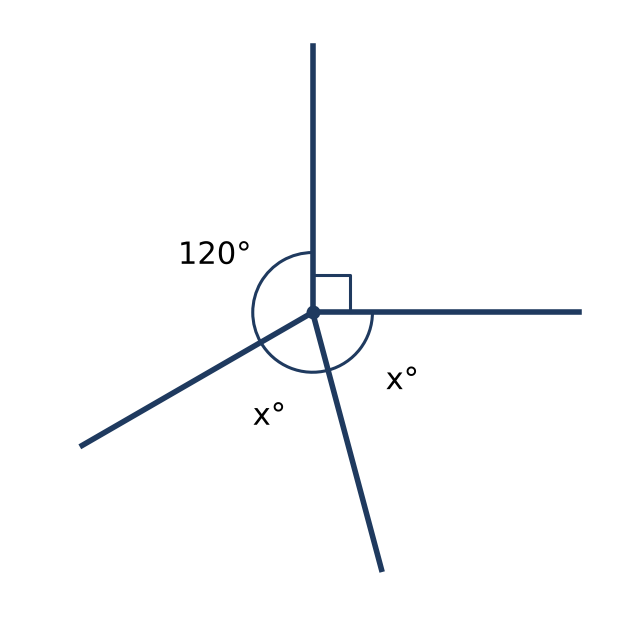
- The angles around a point add to 360°; one angle is a right angle (90°).
- 90 + 120 + x + x = 360, so 2x = 150.
- x = 75 < 80, so Column B is greater.
- A (The quantity in Column A is greater.): forgets the right angle: 2x = 360 − 120, x = 120
- C (The two quantities are equal.): judges x from the picture, where it looks about 80°
- D (The relationship cannot be determined from the information given.): does not use the right-angle mark as 90°
Area unit conversion — square yards to square feet
Method. Square the conversion factor: 3 × 3 = 9 per square yard.
Worked example| Column A | Column B |
|---|---|
| The number of square feet in 3 square yards | 18 |
- 1 yard = 3 feet, so 1 square yard = 3 × 3 = 9 square feet.
- 3 square yards = 3 × 9 = 27 square feet.
- 27 > 18, so Column A is greater.
- B (The quantity in Column B is greater.): uses 1 square yard = 3 square feet: 3 × 3 = 9
- C (The two quantities are equal.): adds instead of multiplying: 1 square yard = 3 + 3 = 6 square feet, so 3 × 6 = 18
- D (The relationship cannot be determined from the information given.): thinks square units cannot be converted without a shape
add a percent fee
Method. 25% is one quarter: $40 ÷ 4 = $10, so the total is $50.
Worked example| Column A | Column B |
|---|---|
| the total cost of the ticket with the fee | $48 |
- 25% of $40 = × $40 = $10.
- Total cost = $40 + $10 = $50.
- $50 > $48, so Column A is greater.
- B (The quantity in Column B is greater.): Subtracts the fee as if it were a discount: $40 − $10 = $30.
- C (The two quantities are equal.): Uses 20% instead of 25%: $40 + $8 = $48.
- D (The relationship cannot be determined from the information given.): Thinks the fee depends on the number of tickets bought.
mean from a bar graph
Method. Balance around 30: +10, −5, +5, −10 sum to 0, so the mean is 30, which is above 25.
Worked example| Column A | Column B |
|---|---|
| the mean number of cans collected per class | the number of cans Class 6B collected |
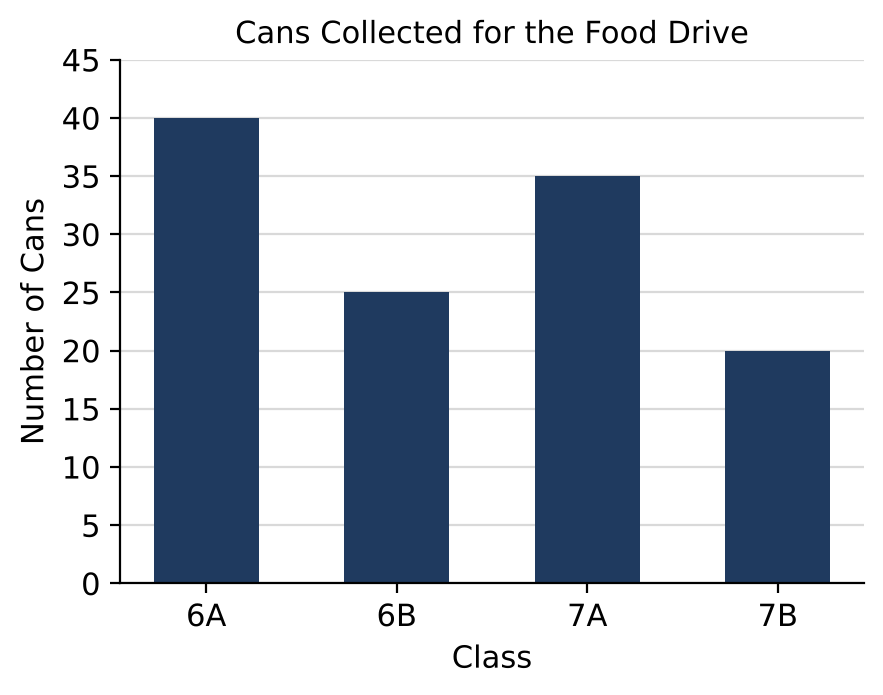
- From the graph: 6A 40, 6B 25, 7A 35, 7B 20.
- Total = 40 + 25 + 35 + 20 = 120.
- Mean = 120 ÷ 4 = 30.
- Class 6B collected 25, and 30 > 25, so Column A is greater.
- B (The quantity in Column B is greater.): Divides the total by 5 (the number of grid steps or an extra class): 120 ÷ 5 = 24 < 25.
- C (The two quantities are equal.): Uses the 2nd of the four bars as shown, 25, as the middle value and calls it the mean.
- D (The relationship cannot be determined from the information given.): Thinks the bars cannot be read exactly without labels on top of them.