Quantitative Reasoning: Unit Study Guide
02.01 Word Problems
The Upper Level ISEE (students in grades 8–11 applying to grades 9–12) has a 37-question Quantitative Reasoning section in 35 minutes: about 20 word problems followed by about 17 quantitative comparisons, four answer choices and no calculator. There is no penalty for a wrong answer, so answer every question. This topic covers word problems that test reasoning more than computation: number sense, ratios, rates and percents, algebraic reasoning, measurement, and data. Geometry formulas for these questions are in 04.04 Geometry and Measurement.
Word Problems
Name the unknown, translate the words into an equation, solve, and answer the question that was asked, with units.
Key formulas| Distance | |
| Work | |
| Mixture | |
| Consecutive integers |
Unit price
Method. Find the cost of one, then multiply.
Worked example- Price of one: $8.75 ÷ 5 = $1.75.
- Cost of 3: 3 × $1.75 = $5.25.
- A ($1.75): gave the price of one comic book
- C ($8.75): gave the cost of 5 comic books
- D ($26.25): multiplied the cost of 5 by 3
Consecutive integers
Method. The middle (average) is 177 ÷ 3; step out from the middle.
Worked example- Let the smallest be n.
- The 3 consecutive integers are n, n + 1, n + 2.
- Their sum: 3n + 3 = 177.
- Subtract 3: 3n = 174.
- Divide: n = 58.
- The smallest is 58.
- A (57): counted one step too far
- C (59): gave the average (middle value)
- D (60): gave the largest number
Simple interest
Method. Interest per year = $210 ÷ 6 = $35, and $35 is 3.5% of $1,000.
Worked example- Interest earned = $1,210 − $1,000 = $210.
- Use I = Prt: 210 = 1,000 × r × 6 = 6,000r.
- So r = 210 ÷ 6,000 = 0.035 = 3.5%.
- A (2.1%): divided the interest by 10,000 instead of by 1,000 × 6
- C (21%): forgot to divide by the 6 years
- D (35%): moved the decimal point the wrong way
Writing equations from words
Method. Fixed amount = constant; per-unit amount = coefficient of x.
Worked example- The fee is paid once: 99.
- The rate is paid for each of the x hours: 30x.
- Total cost = fee + rate × x.
- So 99 + 30x = 279.
- A (99x + 30x = 279): multiplied the fixed fee by x too
- B (99 + 30 + x = 279): added x instead of multiplying it by the rate
- D (30(99 + x) = 279): multiplied the fee by the rate
Writing inequalities from words
Method. “At most / no more than” → ≤; “at least” → ≥; “more than” → >; “less than” → <.
Worked example- Total spent = fee + price × rides = 8 + 7n.
- “No more than” 60 means ≤ 60.
- So 8 + 7n ≤ 60.
- A (8 + 7n ≥ 60): reversed the inequality sign
- C (7n ≤ 60): left out the fixed fee
- D (8 + 7n < 60): changed whether the boundary is included
Interpreting linear models
Method. Change in output = slope × change in input; the constant cancels.
Worked example- The coefficient 45 is the change in C for each increase of 1 in h.
- For an increase of 2: 45 × 2 = 90 dollars.
- The constant 50 does not change.
- A (45): gave the increase for 1 unit, not 2
- B (47): added 2 instead of multiplying
- D (140): added the starting value
Age problems
Method. Add the same number of years to BOTH ages before setting up the multiple.
Worked example- Let Leo's age now be b.
- So Omar is 3b.
- In 16 years: 3b + 16 = 2(b + 16).
- Expand: 3b + 16 = 2b + 32.
- Subtract 2b and 16: b = 16.
- B (32): gave Leo's age in 16 years
- C (48): gave Omar's age instead of Leo's
- D (64): gave Omar's age in 16 years
Distance, rate and time
Method. Distance = rate × time; opposite directions or toward each other → add speeds, same direction → subtract.
Worked example- Moving apart, the distance grows at 33 + 55 = 88 miles per hour.
- Time = distance ÷ rate: 44 ÷ 88 = 0.5 hours.
- B (0.8): used only the second car's speed
- C (1): divided by the average speed instead of the sum of the speeds
- D (2): subtracted the speeds instead of adding
Work problems
Method. Together time = (product)/(sum) of the two times.
Worked example- Sofia does of the job per hour and Priya does .
- Together: + = of the job per hour.
- Time = 1 ÷ = 6 hours.
- A (): gave the combined rate (jobs per hour) instead of the time
- C (16): averaged the two times
- D (32): added the two times
Averages
Method. New score = new average + (number of old tests) × (rise in average) = 87 + 5 × 2.
Worked example- Current total: 5 × 85 = 425.
- Needed total for 6 tests: 6 × 87 = 522.
- Next score: 522 − 425 = 97.
- A (12): multiplied the gap by 6
- B (87): gave the target average
- C (89): averaged the old average and the new score only
Inequalities in context
Method. Subtract the fixed cost, divide by the unit price, then round DOWN.
Worked example- Write the inequality: 5 + 3n ≤ 75.
- Subtract 5: 3n ≤ 70.
- Divide by 3: n ≤ ≈ 23.3.
- n must be a whole number.
- So the greatest is 23.
- B (24): rounded up instead of down
- C (25): ignored the fixed fee
- D (26): added the fee instead of subtracting it
Mixture problems
Method. Balance the differences: 40 × (15 − 10) = y × (40 − 15).
Worked example- Let y = liters of the 40% solution.
- Acid: 0.1(40) + 0.4y = 0.15(40 + y).
- Multiply by 100: 400 + 40y = 600 + 15y.
- Collect: 25y = 200.
- Divide: y = 8 liters.
- A (5): divided by 40 instead of 40 − 15
- C (40): assumed equal amounts of the two solutions
- D (200): inverted the ratio of the differences
Systems from word problems
Method. If all 130 were child tickets: 520; each adult ticket adds 6, so adults = (760 − 520) ÷ 6.
Worked example- Let x = adult tickets and y = child tickets.
- Then x + y = 130 and 10x + 4y = 760.
- Substitute y = 130 − x: 10x + 4(130 − x) = 760.
- So 6x + 520 = 760, 6x = 240, and x = 40.
- Then y = 130 − 40 = 90.
- The number of child tickets is 90.
- A (40): gave the number of adult tickets
- B (54): treated all $760 as adult sales (760 ÷ 10 = 76) and gave 130 − 76
- C (65): split the tickets equally
Ratios, Rates and Proportions
A ratio compares quantities; a proportion sets two ratios equal and is solved by cross-multiplying. Unit rates divide by the second quantity. In direct variation y/x stays the same; in inverse variation xy stays the same.
Key formulas| Proportion | |
| Unit rate | |
| Scale | |
| Direct variation | |
| Inverse variation | |
| Average speed | |
| Square and cubic units |
Ratios in context
Method. Write the two counts in the order asked, then simplify.
Worked example- First find the number of cats: 77 − 33 = 44.
- The ratio of cats to dogs is 44:33.
- Divide both by 11: 4:3.
- A (3:4): reversed the order of the ratio
- B (4:7): compared cats to all pets
- C (3:7): compared dogs to all pets
Unit rates — better buy
Method. Divide price by size for every choice and compare; ignore the total price.
Worked example- Find each price per oz: $5.22 ÷ 29 ≈ $0.180.
- $1.32 ÷ 12 ≈ $0.110.
- $2.99 ÷ 13 ≈ $0.230.
- $1.70 ÷ 17 ≈ $0.100.
- The lowest is 17 oz for $1.70.
- A (12 oz for $1.32): chose the lowest total price instead of the lowest price per unit
- C (29 oz for $5.22): chose the largest package without comparing unit prices
- D (13 oz for $2.99): chose the highest price per unit
Measurement conversions
Method. A 6-inch piece is half a foot, so count halves: 6 ÷ = 13.
Worked example- Each foot is 12 inches.
- The board is 6 × 12 = 78 inches long.
- Number of pieces = 78 ÷ 6 = 13.
- A (12): left out the half foot (6 × 12 ÷ 6)
- C (39): multiplied the feet by 6 without converting to inches
- D (78): gave the length in inches, not the number of pieces
Proportional relationships — constant from a graph
Method. Read any labelled point (x, y) on the line and divide y by x.
Worked example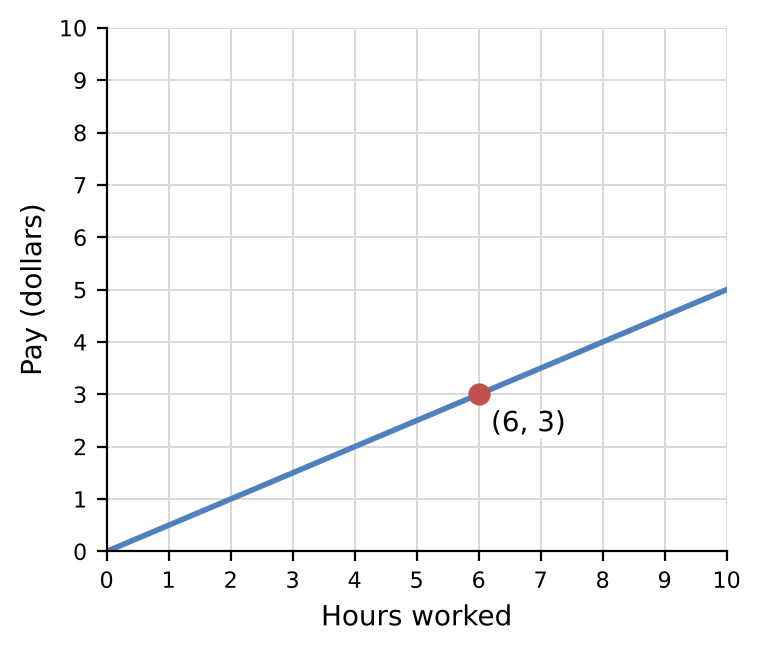
- The line passes through the origin and the point (6, 3).
- k = y ÷ x = 3 ÷ 6 = .
- B (2): divided x by y instead of y by x
- C (3): subtracted the coordinates
- D (18): multiplied the coordinates
Density
Method. Density = mass ÷ volume: 10.5 ÷ 7 = 1.5 grams per cubic centimeter.
Worked example- Density = mass ÷ volume.
- Density = 10.5 ÷ 7.
- So Density = 1.5 grams per cubic centimeter.
- A (): divided volume by mass
- C (3.5): subtracted volume from mass
- D (73.5): multiplied mass by volume
Speed — find the distance
Method. Change the minutes to hours first, then distance = speed × time.
Worked example- 30 minutes = = 0.5 hour.
- So the time is 1.5 hours.
- Distance = speed × time = 72 × 1.5 = 108 miles.
- A (72): ignored the minutes
- B (93.6): treated 1 hour 30 minutes as 1.30 hours
- D (2,232): added the minutes as if they were hours
Inverse variation — work problems
Method. Multiply the given pair, then divide by the new value.
Worked example- Inverse variation: x × y stays constant.
- 4 × 36 = 144.
- So y = 144 ÷ 16 = 9.
- B (24): kept the sum of x and y constant
- C (48): added the change in x to y
- D (144): used direct variation instead of inverse variation
Inverse variation
Method. Multiply the given pair, then divide by the new value.
Worked example- Inverse variation: x × y stays constant.
- 15 × 6 = 90.
- So y = 90 ÷ 10 = 9.
- A (1): added the change in x to y
- B (4): used direct variation instead of inverse variation
- D (11): kept the sum of x and y constant
Sharing in a ratio
Method. Add the ratio numbers, find one part, then multiply.
Worked example- Total parts: 2 + 3 + 4 = 9.
- One part = $1,080 ÷ 9 = $120.
- The largest share is 4 × $120 = $480.
- A ($240): gave the smallest share
- B ($270): divided the total by the ratio number instead of by the total number of parts
- C ($360): gave the middle share
Ratios — find the total
Method. Total = boys × (total parts ÷ boy parts) = 15 × = 42.
Worked example- 5 parts are 15 boys.
- So one part is 15 ÷ 5 = 3.
- The club has 5 + 9 = 14 parts: 14 × 3 = 42 students.
- A (24): added the girls' ratio number to the number of boys
- B (27): found the number of girls only
- C (29): added the ratio total to the number of boys
Unit conversions with square and cubic units
Method. Square units use the factor squared ; cubic units use it cubed .
Worked example- One square yard is 3 × 3 = 9 square feet, because every dimension is converted.
- So 3 square yards = 3 × 9 = 27 square feet.
- A (): divided instead of multiplying
- B (9): multiplied by the length factor 3 only
- D (81): used the cubic factor instead of the square factor
Dimensional analysis — rate conversions
Method. Multiply by conversion fractions so unwanted units cancel; check every unit is converted.
Worked example- 36 km/h × (1,000 m / 1 km) × (1 h / 3,600 s) = 36 × 1,000 ÷ 3,600.
- 36,000 ÷ 3,600 = 10, so the speed is 10 .
- A (0.6): divided by 60 only (hours to minutes)
- C (129.6): multiplied by 3.6 instead of dividing
- D (36,000): converted kilometers to meters but not hours to seconds
Multi-step rate problems
Method. Find the per-minute rate first, convert all time to minutes, then multiply.
Worked example- Rate: 24 ÷ 4 = 6 pages per minute.
- Time: 2 × 60 + 24 = 144 minutes.
- Pages: 6 × 144 = 864.
- A (720): ignored the extra minutes
- C (1,344): treated 2 hours as 200 minutes
- D (3,456): used 24 pages per minute instead of per 4 minutes
Average speed for a round trip
Method. For equal distances, average speed = 2ab/(a + b) = 2 × 30 × 45 ÷ 75 = 36.
Worked example- Time out = 270 ÷ 30 = 9 h.
- Time back = 270 ÷ 45 = 6 h.
- Total distance 540 miles ÷ total time 15 h = 36 mph.
- B (37.5): averaged the two speeds
- C (60): used only the time for the first part of the trip
- D (90): used only the time for the return trip
Percents
Percent means per hundred. Change the percent to a decimal or fraction, then multiply. Percent change compares the change with the original amount. For two changes in a row, multiply by both factors; do not add the percents.
Key formulas| Percent of | |
| Percent change | |
| Increase / decrease by r% | |
| Find the original | |
| Successive changes | |
| Simple interest |
Fraction to percent
Method. = 12.5%, so = 7 × 12.5% = 87.5%.
Worked example- Divide to get a decimal: 7 ÷ 8 = 0.875.
- Multiply by 100: 0.875 × 100 = 87.5%.
- A (0.875%): wrote the decimal as the percent (did not multiply by 100)
- B (12.5%): used the other part (100% minus the answer)
- C (78%): wrote the top and bottom numbers side by side as a percent
Percent increase and decrease
Method. New ÷ original = 2.5, so the change is 2.5 − 1 = +1.5 → 150%.
Worked example- Change = 140 − 56 = 84.
- Percent change = change ÷ original × 100 = 84 ÷ 56 × 100 = 150%.
- A (60%): divided by the new value instead of the original
- B (84%): gave the amount of change as the percent
- D (250%): gave the new value as a percent of the original
Simple interest
Method. One year's interest is $80.00; multiply by 6 years and add the principal.
Worked example- Simple interest I = P × r × t = $4,000 × 0.02 × 6 = $480.00.
- Total = $4,000 + $480.00 = $4,480.00.
- A ($48.00): moved the decimal point one place too far left in the rate
- B ($80.00): found the interest for one year only
- C ($480.00): gave the interest only, not the total
Tax and tips
Method. Multiply by 1.175 (117.5%) in one step: 1.175 × $76.80 = $90.24.
Worked example- Sales tax = 17.5% of $76.80 = 0.175 × $76.80 = $13.44.
- Total = $76.80 + $13.44 = $90.24.
- A ($13.44): gave the sales tax only, not the total
- B ($63.36): subtracted the sales tax instead of adding it
- D ($94.30): added 17.5 dollars instead of 17.5%
Reverse percent — find the original
Method. Divide by the multiplier (1.1); do not take 10% of the new amount.
Worked example- The new amount is 110% of the original.
- So original = $360.80 ÷ 1.1 = $328.00.
- A ($32.80): moved the decimal point one place too far left
- B ($36.08): gave the percent of the new price
- C ($324.72): subtracted 10% of the new price
Percent of a percent
Method. Multiply the decimals: 0.2 × 0.4 × 1,750 = 140.
Worked example- Work from the right: 40% of 1,750 = 700.
- Then 20% of 700 = 140.
- A (14): moved the decimal point one place too far left
- C (350): found only 20% of 1,750
- D (1,050): added the percents
Percentage points versus percent change
Method. Percentage points = simple difference of the rates; percent change = that difference ÷ the original rate × 100.
Worked example- The rate changed by 9 − 8 = 1 percentage point.
- Percent change = 1 ÷ 8 × 100 = 12.5%.
- A (1%): gave the change in percentage points, not the percent change
- C (17%): added the two rates
- D (112.5%): gave the new rate as a percent of the old rate
Successive percent changes
Method. Multiply the multipliers: 1.1 × 0.9 = 0.99, then × $160.00 = $158.40.
Worked example- Increase: $160.00 × 1.1 = $176.00.
- Decrease that by 10%: $176.00 × 0.9 = $158.40.
- A ($15.84): moved the decimal point one place too far left
- B ($17.60): gave the amount of the second change instead of the final price
- C ($144.00): applied only the decrease
Graphs and Tables
Read the title, axes, scale and units before reading values. Bar graphs compare categories, line graphs show change over time, circle graphs show parts of a whole, and histograms show how many values fall in each interval.
Key formulas| Percent of whole | |
| Circle graph angle | |
| Change |
Circle graphs
Method. Number = percent × total ÷ 100.
Worked example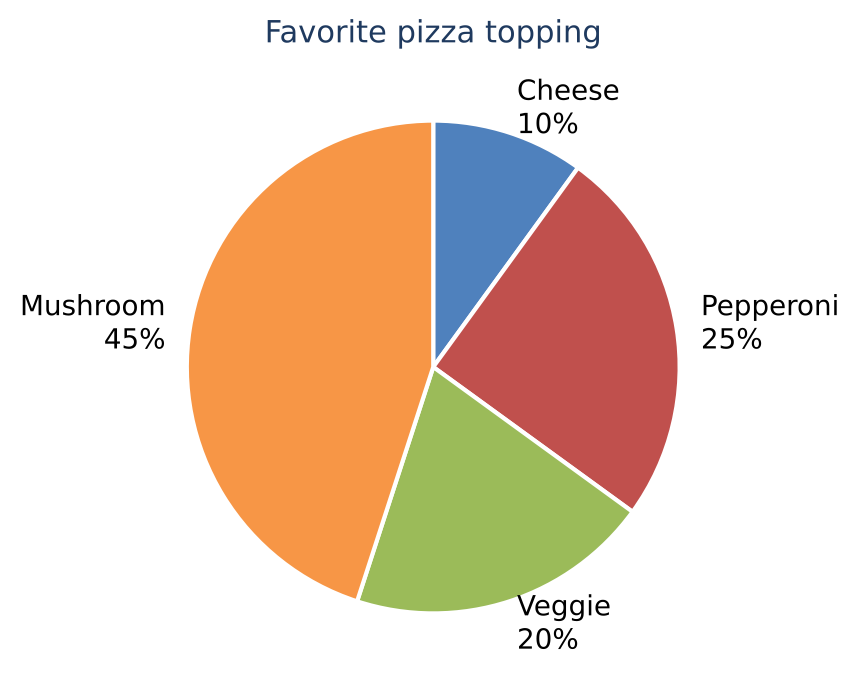
- The percents differ by 25% − 20% = 5%.
- Then 5% of 60 is × 60 = 3.
- B (5): subtracted the percents but did not find them of the total
- C (15): gave the number for Pepperoni only
- D (27): added instead of subtracting
Histograms
Method. Add the heights of the bars from 40 onward.
Worked example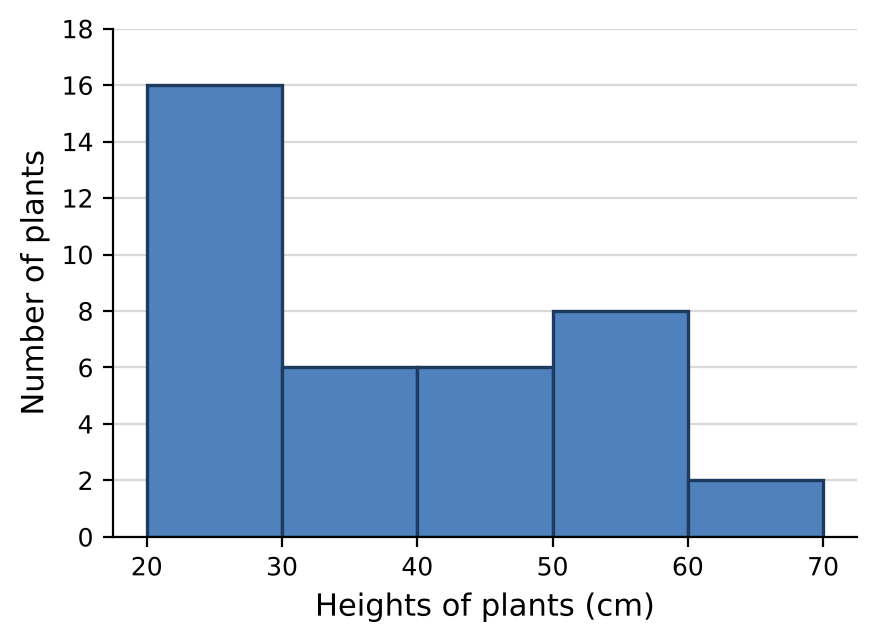
- At least 40 starts with the bar 40–50.
- Add that bar and every bar to its right.
- So 6 + 8 + 2 = 16.
- A (6): used only one bar
- C (22): counted the bars below
- D (38): counted every bar
Building data displays
Method. Angle = (part ÷ total) × 360°.
Worked example- The total is 9 + 5 + 4 + 27 = 45.
- Oranges is of the data.
- The angle is × 360° = 216°.
- A (27): gave the count
- B (60): found the percent instead of the angle
- C (90): split the circle equally
Line graphs
Method. Only falling segments are decreases; compare their drops: 30 and 40.
Worked example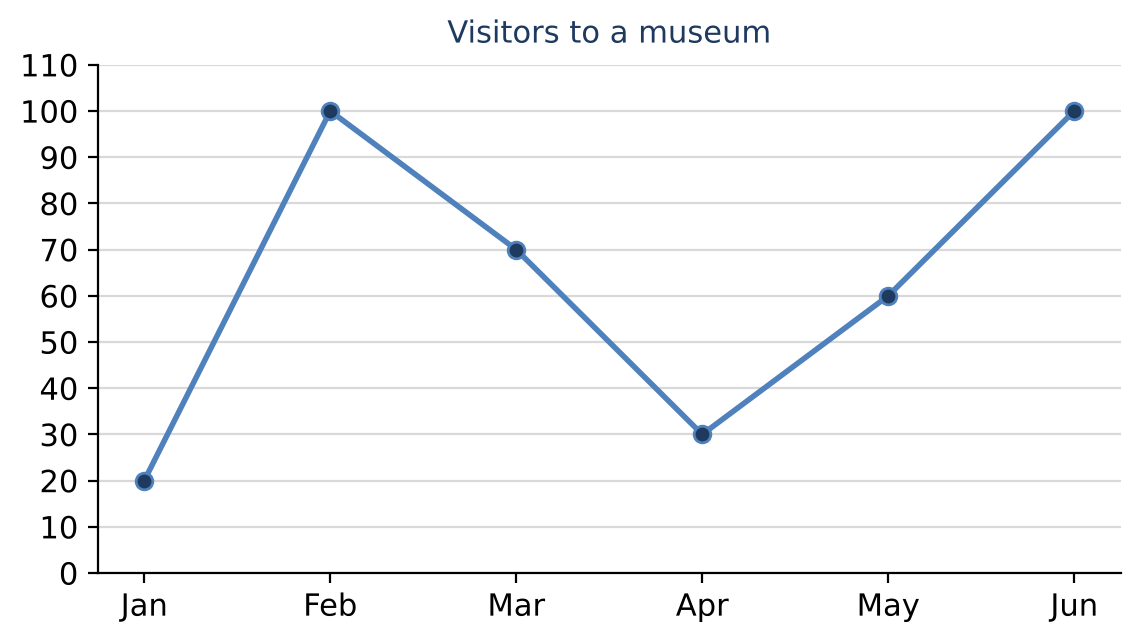
- Read the points: Jan 20, Feb 100, Mar 70, Apr 30, May 60, Jun 100.
- The decreases are February to March (100 − 70 = 30) and March to April (70 − 30 = 40).
- The larger decrease is 40, from March to April.
- A (January to February): chose the greatest change, which is an increase (+80)
- B (February to March): chose the first decrease without comparing its size (30 < 40)
- D (April to May): chose the segment next to the lowest point, which is an increase (+30)
Stem-and-leaf plots
Method. Least = first leaf on the top stem; greatest = last leaf on the bottom stem.
Worked example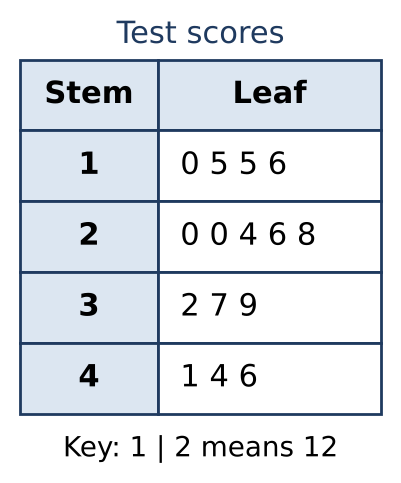
- The least value is 10 (first stem, first leaf).
- The greatest value is 46 (last stem, last leaf).
- The difference is 46 − 10 = 36.
- A (30): subtracted the stems only
- B (31): used the second-least value
- C (34): used the second-greatest value
Two-way tables
Method. Of those who … → divide by that group's total.
Worked example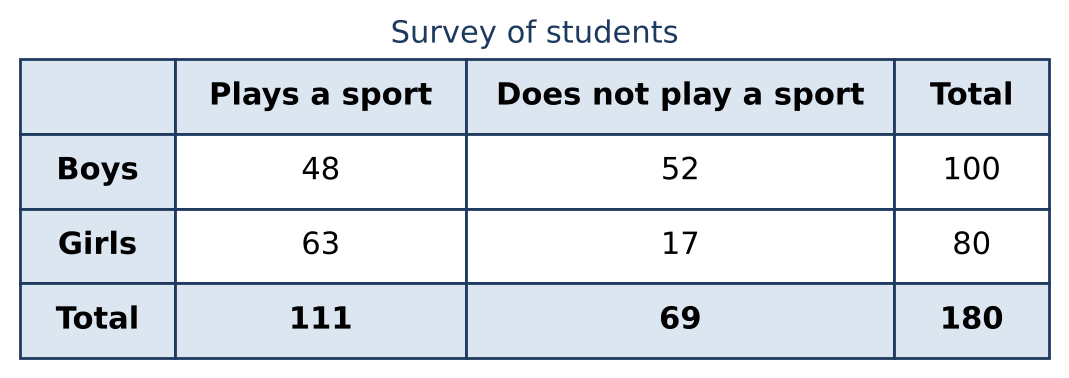
- The group is everyone in the Plays a sport column.
- So divide by that column total, 111.
- Then 63 ÷ 111 = .
- A (): divided by the grand total
- C (): found the fraction of all students in the Plays a sport column
- D (): divided by the Girls row total
Misleading graphs
Method. Read values on the scale; a cut axis makes the bars' heights misleading.
Worked example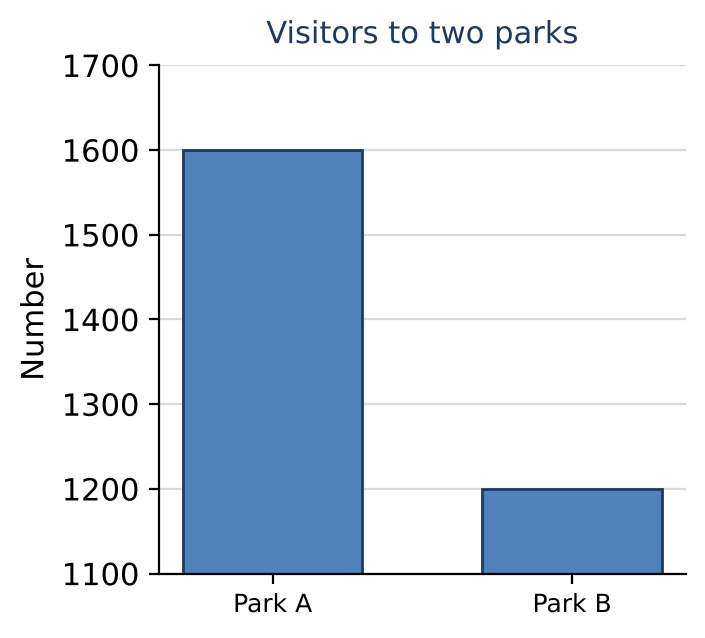
- Each bar's drawn height starts at 1100.
- Park A's bar is 1600 − 1100 = 500 tall and Park B's is 1200 − 1100 = 100 tall.
- So it looks 500 ÷ 100 = 5 times as tall.
- A (): inverted the ratio
- B (): subtracted the starting value from one bar only
- C (): used the actual values instead of the bar heights
Probability
Probability is favorable outcomes over equally likely total outcomes. For a conditional probability, restrict to the given row or column of a table. The expected count is the probability times the number of trials; the expected value adds each value times its probability (count a loss as negative).
Key formulas| Basic | |
| Complement | |
| Addition | |
| Independent | |
| Conditional | |
| Expected count | |
| Expected value |
Expected counts
Method. Expected count = probability × number of spins.
Worked example- P(yellow) = .
- Multiply by the number of spins.
- So × 55 = 10.
- B (18): treated the three colors as equally likely
- C (45): found the expected number of non-yellow results
- D (110): multiplied by the count of sections instead of the probability
Compound events
Method. Without replacement, reduce both the favorable count and the total for the second draw.
Worked example- First draw: P(blue) = .
- After removing one blue marble, 6 blue remain out of 14.
- So P(both) = × = = .
- B (): replaced the first marble
- C (): did not reduce the number of blue marbles
- D (): added the first-draw probability to itself instead of multiplying
Experimental and theoretical probability
Method. Experimental = observed count ÷ trials.
Worked example- Divide the number of times it happened by the number of trials.
- That gives 16 ÷ 40 = , which simplifies to .
- B (): assumed landing point up and not landing point up are equally likely
- C (): used the other outcome (24 point-down results out of 40)
- D (): divided by the other outcome (16 ÷ 24)
Counting
Multiply choices for each stage. Use permutations when order matters and combinations when it does not.
Key formulas| Counting principle | |
| Factorial | |
| Permutations | |
| Combinations |
Counting principle
Method. Multiply the number of choices for each independent step.
Worked example- Multiply the number of choices for each course.
- 2 × 8 × 3 = 48.
- A (13): added instead of multiplying
- B (16): left out the desserts
- D (96): doubled the count
Sample spaces and tree diagrams
Method. Each coin doubles the number of outcomes: = 256.
Worked example- Each coin has 2 outcomes, and there are 8 coins.
- So the sample space has 2 × 2 × 2 × 2 × 2 × 2 × 2 × 2 = = 256 outcomes.
- A (9): counted the possible numbers of heads
- B (16): multiplied 2 by the number of coins
- C (64): squared the number of coins
Expected value
Method. E = Σ (payoff × probability); losses are negative.
Worked example- Multiply each payoff by its probability and add.
- Win: 100 × = 40.
- Lose: −3 × = −1.8.
- Total 40 − 1.8 = 38.2.
- So the expected value is $38.20 per play.
- B ($38.80): used the winning probability for the loss too
- C ($40.00): ignored the loss
- D ($97.00): ignored the probabilities
Center and Spread
Mean, median and mode describe the center; the range and the mean absolute deviation (MAD) describe the spread. An outlier pulls the mean toward it but barely moves the median. Adding the same number to every value shifts the center but does not change the range or the MAD.
Key formulas| Mean | |
| Sum from the mean | |
| Median | |
| Median (even count) | |
| Mode | |
| Range | |
| Mean absolute deviation | |
| Weighted mean | |
| Add k to every value |
Mean
Method. Mean = sum of the values ÷ how many values there are.
Worked example- Add the values.
- So 14.2 + 12.5 + 11.9 + 8.4 = 47.
- Divide by the count, 4.
- So the mean is 47 ÷ 4 = 11.75.
- A (8.2): left out the greatest value but divided by the full count
- B (11.3): averaged only the greatest and least values
- D (47): found the sum but did not divide
Median
Method. Count to the middle dot (or the middle two) from the left.
Worked example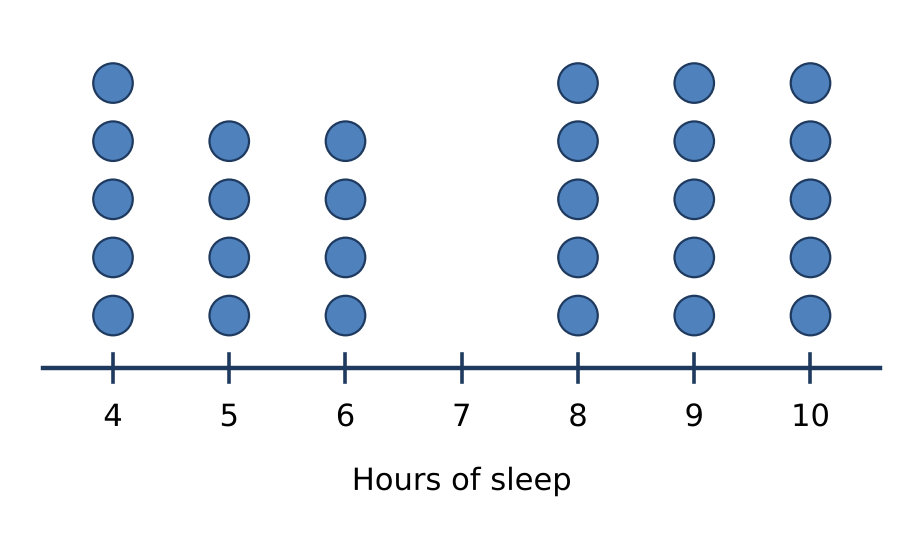
- There are 28 dots in all.
- The median is the mean of the values in positions 14 and 15, counting from the left.
- Those values are 8 and 8.
- So the median is (8 + 8) ÷ 2 = 8.
- A (5): gave the number of dots in the tallest column
- B (7): gave the middle of the number line
- D (14.5): gave the middle position instead of the value
Mean absolute deviation
Method. MAD = average distance from the mean.
Worked example- First find the mean: 20 + 20 + 19 + 13 = 72.
- So the mean is 72 ÷ 4 = 18.
- The distances from 18 are 2, 2, 1, 5.
- Their sum is 10.
- So MAD = 10 ÷ 4 = 2.5.
- A (2): measured distances from the median
- C (7): gave the range
- D (10): added the distances but did not divide
Effect of outliers
Method. Find both means, then subtract; an outlier pulls the mean toward it.
Worked example- The mean with every value is 248 ÷ 8 = 31.
- The outlier is 136.
- Without it, the mean is 112 ÷ 7 = 16.
- The decrease is 31 − 16 = 15.
- A (0): found the change in the median
- C (17): divided the outlier by the count
- D (31): gave the original mean
Weighted mean
Method. Combined mean = total of all scores ÷ total count, not the average of the two means.
Worked example- Total for the first class is 8 × 66 = 528.
- Total for the second class is 12 × 88 = 1056.
- The combined mean is (528 + 1056) ÷ 20 = 79.2.
- A (74.8): matched each mean with the other group's size
- B (77): averaged the two means
- D (1584): gave the total, not the mean
Missing value from a mean
Method. Missing value = mean × count − sum of the known values.
Worked example- The total of all 5 numbers is 59 × 5 = 295.
- The known numbers add to 209.
- So the missing number is 295 − 209 = 86.
- A (27): multiplied the mean by one less than the count
- B (52.25): averaged the known values
- C (59): gave the mean
Comparing data sets
Method. Find the mean of each set separately, then subtract.
Worked example- Mean of A = 427 ÷ 7 = 61.
- Mean of B = 280 ÷ 7 = 40.
- The difference is 61 − 40 = 21.
- A (6): compared the ranges
- C (23): compared the medians instead
- D (147): compared the sums
02.02 Quantitative Comparisons
The Upper Level ISEE (students in grades 8–11 applying to grades 9–12) has a 37-question Quantitative Reasoning section in 35 minutes: about 20 word problems followed by about 17 quantitative comparisons, four answer choices and no calculator. There is no penalty for a wrong answer, so answer every question. Each quantitative comparison gives two quantities, one in Column A and one in Column B (with any information about them centered above). Choose (A) if the quantity in Column A is greater, (B) if the quantity in Column B is greater, (C) if the two quantities are equal, and (D) if the relationship cannot be determined from the information given.
Quantitative Comparisons
Compare Column A with Column B without always computing both exactly: simplify, estimate, or change both columns the same way. When a variable is involved, test several allowed values (a positive whole number, a fraction between 0 and 1, zero or a negative number if allowed); if different values give different results, the answer is (D).
Key formulas| Choose (A) | |
| Choose (B) | |
| Choose (C) | |
| Choose (D) | |
| Same change to both | |
| Multiplying by a negative | |
| Test special values |
Compare negative powers of different bases
Method. A negative exponent means a reciprocal: compare with ; the smaller denominator wins.
Worked example| Column A | Column B |
|---|---|
- = = .
- = = .
- > because 8 < 9, so Column A is greater.
- B (The quantity in Column B is greater.): compares = 8 with = 9 and forgets that the negative exponents turn them into reciprocals
- C (The two quantities are equal.): multiplies base by exponent and gets −6 for both (2 × −3 and 3 × −2)
- D (The relationship cannot be determined from the information given.): believes powers with different bases and exponents cannot be compared without a calculator
Remainders of one number for two divisors
Method. Find the largest multiple below 100: 98 leaves 2, 99 leaves 1.
Worked example| Column A | Column B |
|---|---|
| The remainder when 100 is divided by 7 | The remainder when 100 is divided by 9 |
- 7 × 14 = 98, so 100 = 98 + 2 and the remainder is 2.
- 9 × 11 = 99, so 100 = 99 + 1 and the remainder is 1.
- 2 > 1, so Column A is greater.
- B (The quantity in Column B is greater.): thinks 7 × 14 = 100, so the remainder for 7 is 0
- C (The two quantities are equal.): assumes 7 × 14 = 99 as with 9 × 11 = 99, so both remainders are 1
- D (The relationship cannot be determined from the information given.): believes remainders for different divisors cannot be compared
linear inequality, sign flip
Method. Find x < −3; −8 lies inside that range, so x can be on either side of −8.
Worked example| Column A | Column B |
|---|---|
| x | −8 |
- Subtract 5: −2x > 6.
- Divide by −2 and flip the sign: x < −3.
- x = −5 is allowed and −5 > −8, so Column A is greater.
- x = −9 is allowed and −9 < −8, so Column B is greater.
- The relationship cannot be determined.
- A (The quantity in Column A is greater.): forgets to flip the sign, getting x > −3, so x is always greater than −8
- B (The quantity in Column B is greater.): adds 5 to 11 and flips: −2x > 16, x < −8, so x is always less than −8
- C (The two quantities are equal.): adds 5 to 11 and solves −2x = 16 as an equation, getting x = −8
square-root equation, two roots
Method. Remember the negative root: = 49.
Worked example| Column A | Column B |
|---|---|
| x | 7 |
- = 49 has two solutions: x = 7 and x = −7.
- x = 7 makes the quantities equal; x = −7 makes Column B greater.
- The relationship cannot be determined.
- A (The quantity in Column A is greater.): divides 49 by 2 instead of taking a square root, getting x = 24.5
- B (The quantity in Column B is greater.): uses only the negative root, x = −7
- C (The two quantities are equal.): uses only the positive root, x = 7
midpoint coordinates
Method. Average the coordinates: = 3 and = 4.
Worked example| Column A | Column B |
|---|---|
| the x-coordinate of the midpoint of the segment joining (−4, 6) and (10, 2) | the y-coordinate of the midpoint of the segment joining (1, −5) and (3, 13) |
- x-coordinate of the first midpoint = = 3.
- y-coordinate of the second midpoint = = 4.
- 3 < 4, so Column B is greater.
- A (The quantity in Column A is greater.): drops the negative sign in the first pair, = 7, and compares 7 with 4
- C (The two quantities are equal.): finds the y-coordinate of the first midpoint, = 4, instead of its x-coordinate
- D (The relationship cannot be determined from the information given.): thinks two different segments cannot be compared
regular polygon interior angle
Method. Exterior angle = 72, so interior = 180 − 72 = 108.
Worked example| Column A | Column B |
|---|---|
| the measure of each interior angle of a regular pentagon | 110° |
- Sum of interior angles = (5 − 2) × 180 = 540°.
- Each angle = 540 ÷ 5 = 108°.
- 108° < 110°, so Column B is greater.
- A (The quantity in Column A is greater.): uses n × 180 = 900° as the angle sum, so each angle is 180° > 110°
- C (The two quantities are equal.): estimates the angle as 'about 110°' without computing
- D (The relationship cannot be determined from the information given.): thinks the angle depends on the pentagon's side length
Spinner probabilities from a figure
Method. Count each list: three primes and three multiples of 3 among 8 equal sections.
Worked example| Column A | Column B |
|---|---|
| The probability that the arrow lands on a prime number | The probability that the arrow lands on a multiple of 3 |
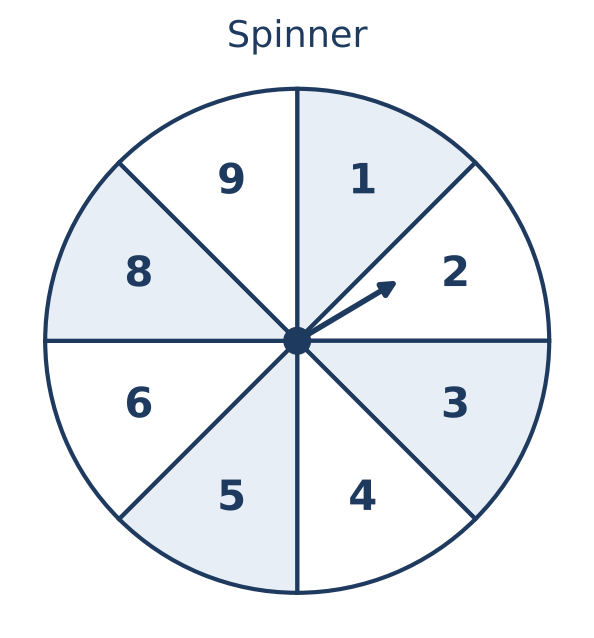
- The spinner shows 1, 2, 3, 4, 5, 6, 8 and 9.
- Primes: 2, 3 and 5, so P(prime) = (1 is not prime).
- Multiples of 3: 3, 6 and 9, so P(multiple of 3) = .
- The probabilities are equal.
- A (The quantity in Column A is greater.): counts 1 as a prime, giving
- B (The quantity in Column B is greater.): forgets that 2 is prime and gets
- D (The relationship cannot be determined from the information given.): thinks that because 3 belongs to both lists the two probabilities cannot be compared
Distance from rate and time
Method. 12 × 2.5 = 12 × = 30 and 7.5 × 4 = 30.
Worked example| Column A | Column B |
|---|---|
| The distance the cyclist rides, in miles | The distance the boat travels, in miles |
- Cyclist: 12 × 2.5 = 30 miles.
- Boat: 7.5 × 4 = 30 miles.
- The distances are equal.
- A (The quantity in Column A is greater.): thinks the faster speed always gives the greater distance
- B (The quantity in Column B is greater.): thinks the longer time always gives the greater distance
- D (The relationship cannot be determined from the information given.): thinks different speeds and times cannot be compared