Problem-Solving and Data Analysis: Unit Study Guide
- 03.01 Ratios, Rates, Proportions and Units
- 03.02 Percentages
- 03.03 One-Variable Data: Distributions, Center and Spread
- 03.04 Two-Variable Data: Models and Scatterplots
- 03.05 Probability and Conditional Probability
- 03.06 Inference from Samples and Margin of Error
- 03.07 Evaluating Statistical Claims
03.01 Ratios, Rates, Proportions and Units
Problem-Solving and Data Analysis is about 15% of SAT Math (5–7 of 44 questions). This topic covers ratios, rates and proportions: unit rates, scale drawings, sharing in a ratio, direct and inverse variation, unit conversions (including square and cubic units), and rate problems such as distance, work and mixtures.
Ratios, Rates and Proportions
A ratio compares quantities; a proportion sets two ratios equal and is solved by cross-multiplying. Unit rates divide by the second quantity.
Key formulas| Proportion | |
| Unit rate | |
| Scale |
Proportional relationships — constant from a graph
Method. Read any labeled point (x, y) on the line and divide y by x.
Worked example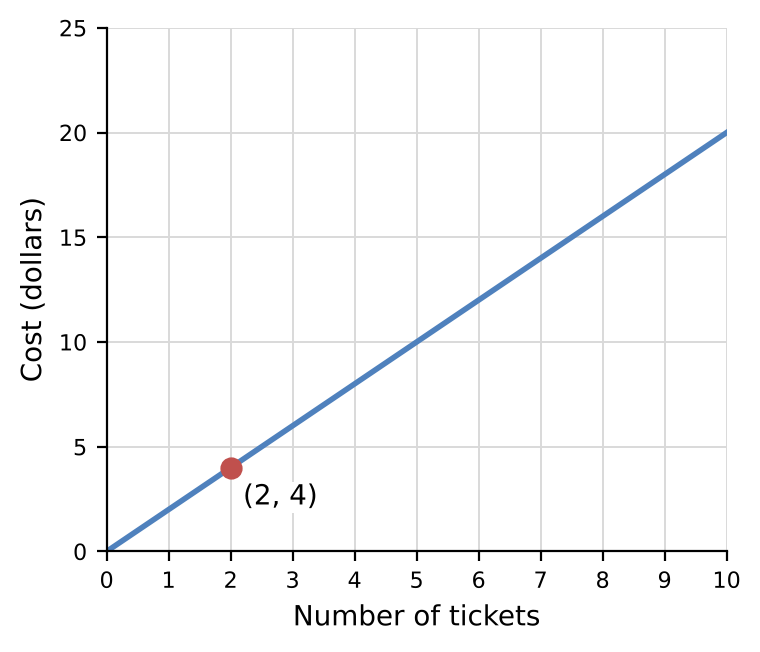
- The line passes through the origin and the point (2, 4).
- k = y ÷ x = 4 ÷ 2 = 2.
- A (): divided x by y instead of y by x
- C (4): gave the y-value of the point
- D (8): multiplied the coordinates
Unit conversions with square and cubic units
Method. Square units use the factor squared ; cubic units use it cubed .
Worked example- One square meter is 100 × 100 = 10,000 square centimeters, because every dimension is converted.
- So 5 square meters = 5 × 10,000 = 50,000 square centimeters.
- A (0.0005): divided instead of multiplying
- B (500): multiplied by the length factor 100 only
- C (1,000): multiplied by 100 × 2 instead of 100 to the power 2
Inverse variation — work problems
Method. Multiply the given pair, then divide by the new value.
Worked example- Inverse variation: x × y stays constant.
- 2 × 20 = 40.
- So y = 40 ÷ 10 = 4.
- B (12): kept the sum of x and y constant
- C (40): gave the product xy (the constant) instead of y
- D (100): used direct variation instead of inverse variation
Inverse variation
Method. Multiply the given pair, then divide by the new value.
Worked example- Inverse variation: x × y stays constant.
- 4 × 5 = 20.
- So y = 20 ÷ 5 = 4.
- B (6): added the change in x to y
- C (6.25): used direct variation instead of inverse variation
- D (20): gave the product xy (the constant) instead of y
Dimensional analysis — rate conversions
Method. Multiply by conversion fractions so unwanted units cancel; check every unit is converted.
Worked example- 4 mL/min × 60 min/h × 24 h/day = 5,760 mL per day.
- ÷ 1,000 = 5.76 liters.
- A (0.096): multiplied by 24 but forgot the 60 minutes in an hour
- B (0.24): found liters per hour, not per day
- D (5,760): did not convert milliliters to liters
Sharing in a ratio
Method. Add the ratio numbers, find one part, then multiply.
Worked example- Total parts: 2 + 5 + 7 = 14.
- One part = $630 ÷ 14 = $45.
- The smallest share is 2 × $45 = $90.
- A ($45): gave the value of one part only
- C ($225): gave the middle share
- D ($315): gave the largest share
Ratios — find the total
Method. Total = boys × (total parts ÷ boy parts) = 16 × = 20.
Worked example- 4 parts are 16 boys.
- So one part is 16 ÷ 4 = 4.
- The club has 4 + 1 = 5 parts: 5 × 4 = 20 students.
- A (4): found the number of girls only
- B (17): added the girls' ratio number to the number of boys
- D (21): added the ratio total to the number of boys
Multi-step rate problems
Method. Find the per-minute rate first, convert all time to minutes, then multiply.
Worked example- Rate: 36 ÷ 3 = 12 pages per minute.
- Time: 3 × 60 + 20 = 200 minutes.
- Pages: 12 × 200 = 2,400.
- A (2,160): ignored the extra minutes
- C (3,840): treated 3 hours as 300 minutes
- D (7,200): used 36 pages per minute instead of per 3 minutes
Average speed for a round trip
Method. For equal distances, average speed = 2ab/(a + b) = 2 × 20 × 60 ÷ 80 = 30.
Worked example- Time out = 180 ÷ 20 = 9 h.
- Time back = 180 ÷ 60 = 3 h.
- Total distance 360 miles ÷ total time 12 h = 30 mph.
- A (15): used the one-way distance with the total time
- C (40): averaged the two speeds
- D (120): used only the time for the return trip
Rate Problems
Distance, work and mixture problems are rate problems: rate × time = amount.
Key formulas| Distance | |
| Work together | |
| Mixture |
Distance, rate and time
Method. Distance = rate × time; opposite directions or toward each other → add speeds, same direction → subtract.
Worked example- Moving apart, the distance grows at 32 + 37 = 69 miles per hour.
- Time = distance ÷ rate: 138 ÷ 69 = 2 hours.
- A (1): doubled the sum of the speeds
- C (4): divided by the average speed instead of the sum of the speeds
- D (27.6): subtracted the speeds instead of adding
Work problems
Method. Together time = (product)/(sum) of the two times.
Worked example- Leo does of the job per hour and Dev does .
- Together: + = of the job per hour.
- Time = 1 ÷ = 5 hours.
- A (0.2): gave the combined rate (jobs per hour) instead of the time
- C (18): averaged the two times
- D (36): added the two times
Mixture problems
Method. Balance the differences: 30 × (60 − 20) = y × (75 − 60).
Worked example- Let y = liters of the 75% solution.
- Acid: 0.2(30) + 0.75y = 0.6(30 + y).
- Multiply by 100: 600 + 75y = 1800 + 60y.
- Collect: 15y = 1200.
- Divide: y = 80 liters.
- A (16): divided by 75 instead of 75 − 60
- B (30): assumed equal amounts of the two solutions
- D (110): gave the total amount of the mixture
03.02 Percentages
Problem-Solving and Data Analysis is about 15% of SAT Math (5–7 of 44 questions). This topic covers percents: percent of a quantity, percent increase and decrease, finding the original amount, successive changes with multipliers, percent of a percent, and percentage points versus percent change.
Percents
Percent means per hundred. Convert to a decimal, then multiply; percent change compares the change with the original.
Key formulas| Percent of | |
| Percent change | |
| Multiplier | |
| Successive changes | |
| Original amount | |
| Percentage points |
Percent increase and decrease
Method. New ÷ original = 0.625, so the change is 0.625 − 1 = −0.375 → 37.5%.
Worked example- Change = $185.00 − $296.00 = $111.00 (a decrease).
- Percent change = change ÷ original × 100 = 111 ÷ 296 × 100 = 37.5%.
- B (60%): divided by the new value instead of the original
- C (62.5%): gave the new value as a percent of the original
- D (111%): gave the amount of change as the percent
Successive percent changes
Method. Multiply the multipliers: 1.3 × 0.6 = 0.78, then × $100.00 = $78.00.
Worked example- Increase: $100.00 × 1.3 = $130.00.
- Decrease that by 40%: $130.00 × 0.6 = $78.00.
- A ($52.00): gave the amount of the second change instead of the final price
- C ($90.00): added and subtracted the percents as if they apply to the same amount
- D ($130.00): applied only the increase
Mixtures — percent concentration
Method. Weighted average: (amount₁ × percent₁ + amount₂ × percent₂) ÷ total amount.
Worked example- Salt: 0.15 × 90 + 0.3 × 60 = 13.5 + 18 = 31.5 liters, in 150 liters.
- Percent = 31.5 ÷ 150 × 100 = 21%.
- B (22.5%): averaged the two percents without weighting
- C (24%): matched each percent with the wrong amount
- D (45%): added the two percents
Repeated percent growth
Method. 2,900 × = 2,900 × 1.44 = 4,176.
Worked example- Each year multiply by 1.2: 2,900 → 3,480 → 4,176.
- After 2 years: 4,176.
- A (1,276): gave only the increase
- B (3,480): applied the growth for one year only
- C (4,060): added the same amount each year (simple growth)
Reverse percent — find the original
Method. Divide by the multiplier (0.85); do not take 15% of the new amount.
Worked example- The new amount is 85% of the original.
- So original = $190.40 ÷ 0.85 = $224.00.
- A ($161.84): decreased the new price again
- B ($205.40): added 15 dollars
- C ($218.96): added 15% of the new price
Percentage points versus percent change
Method. Percentage points = simple difference of the rates; percent change = that difference ÷ the original rate × 100.
Worked example- The rate changed by 1 percentage point.
- Percent change = 1 ÷ 5 × 100 = 20%.
- A (0.2%): did not multiply by 100
- B (1%): gave the change in percentage points, not the percent change
- C (11%): added the two rates
03.03 One-Variable Data: Distributions, Center and Spread
Problem-Solving and Data Analysis is about 15% of SAT Math (5–7 of 44 questions). This topic covers one-variable data: mean, median, mode and range, the effect of outliers and of changing values, comparing standard deviation and spread without calculating it, box plots, histograms and dot plots.
Center and Spread
Mean, median and mode describe the center; range, IQR and standard deviation describe the spread. An outlier pulls the mean toward it but barely moves the median. Data spread farther from the mean have a larger standard deviation; the SAT asks you to compare, not to calculate it.
Key formulas| Mean | |
| Sum from the mean | |
| Median | |
| Range | |
| IQR | |
| Add k to every value |
Median
Method. Sort first; odd count → middle value, even count → mean of the two middle values.
Worked example- Order the values.
- So 23, 28, 33, 42, 45, 51, 54.
- There are 7 values.
- The middle one is value 4, which is 42.
- So the median is 42.
- A (4): gave the middle position instead of the value
- B (33): took the value just below the middle
- D (45): did not put the values in order first
Interquartile range
Method. IQR = median of the upper half − median of the lower half.
Worked example- Order the values.
- So 1, 2, 3, 14, 20, 25, 44, 48.
- The lower half is 1, 2, 3, 14.
- So Q1 = 2.5.
- The upper half is 20, 25, 44, 48.
- So Q3 = 34.5.
- Then IQR = Q3 − Q1 = 34.5 − 2.5 = 32.
- B (34.5): gave Q3 only
- C (37): added the quartiles
- D (47): gave the range
Effect of outliers
Method. Find both means, then subtract; an outlier pulls the mean toward it.
Worked example- The mean with every value is 198 ÷ 6 = 33.
- The outlier is 88.
- Without it, the mean is 110 ÷ 5 = 22.
- The decrease is 33 − 22 = 11.
- A (0): found the change in the median
- C (22): gave the new mean
- D (33): gave the original mean
Comparing data sets
Method. Find the median of each set separately, then subtract.
Worked example- Ordered, A is 10, 26, 38, 43, 45.
- So its median is 38.
- Ordered, B is 15, 26, 27, 27, 34.
- So its median is 27.
- The difference is 38 − 27 = 11.
- A (6.6): compared the means instead
- C (16): compared the ranges
- D (33): compared the sums
Weighted mean
Method. Weighted mean = Σ(weight × score) with weights as decimals.
Worked example- Multiply each score by its weight.
- So 50% × 69 + 25% × 71 + 25% × 90.
- That is 34.5 + 17.75 + 22.5 = 74.75.
- A (69): used only the score with the largest weight
- C (80): matched the weights to the wrong scores
- D (7,475): did not divide by 100
Missing value from a mean
Method. Needed score = target mean × new count − current total.
Worked example- For a mean of 92 over 4 tests, the total must be 92 × 4 = 368.
- The first 3 scores add to 270.
- So the next score must be 368 − 270 = 98.
- A (6): used the old number of tests
- B (92): gave the target mean
- D (368): gave the total needed
Standard deviation (concept)
Method. Look for values bunched far from the center on both sides, not just one extreme value.
Worked example- Standard deviation measures how far values typically are from the mean.
- In Set P, the values sit farthest from their mean overall (SD ≈ 6.00).
- The other sets have smaller SDs: Set Q ≈ 5.01, Set R ≈ 2.16, Set S ≈ 0.82.
- So the answer is Set P.
- A (Set Q): chose the set with the greatest range
- B (Set R): chose the set with the greatest mean
- D (Set S): chose the set with the least spread
Distributions and Data Displays
Describe a distribution by its shape, center and spread. A box plot shows the five-number summary; a histogram shows how many values fall in each interval. In a right-skewed distribution the mean is usually greater than the median.
Key formulas| Five-number summary | |
| IQR | |
| Right skew | |
| Left skew | |
| Percentile |
Box plots
Method. Range = end of right whisker − end of left whisker.
Worked example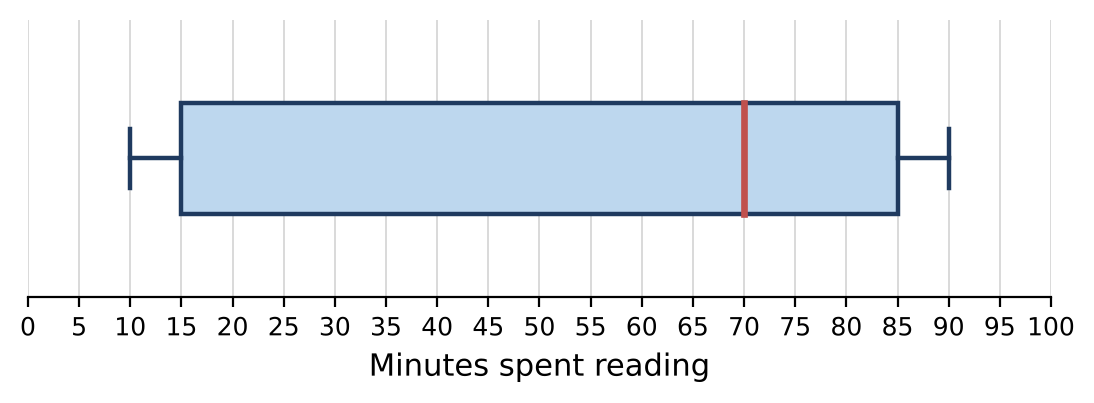
- The whiskers end at the minimum, 10, and the maximum, 90.
- The range is 90 − 10 = 80.
- A (70): found the IQR (the length of the box)
- C (90): read the maximum only
- D (100): added the maximum and the minimum
Five-number summary
Method. Sort, split into lower and upper halves, then take the median of each half.
Worked example- Order the values.
- So 1, 11, 12, 17, 18, 25, 29, 40, 41, 50, 55, 59.
- The lower half is 1, 11, 12, 17, 18, 25.
- Its median is Q1 = 14.5.
- A (11): took the second value
- C (27): gave the median
- D (45.5): gave Q3 instead
Comparing distributions
Method. Read the same feature from both plots, then subtract.
Worked example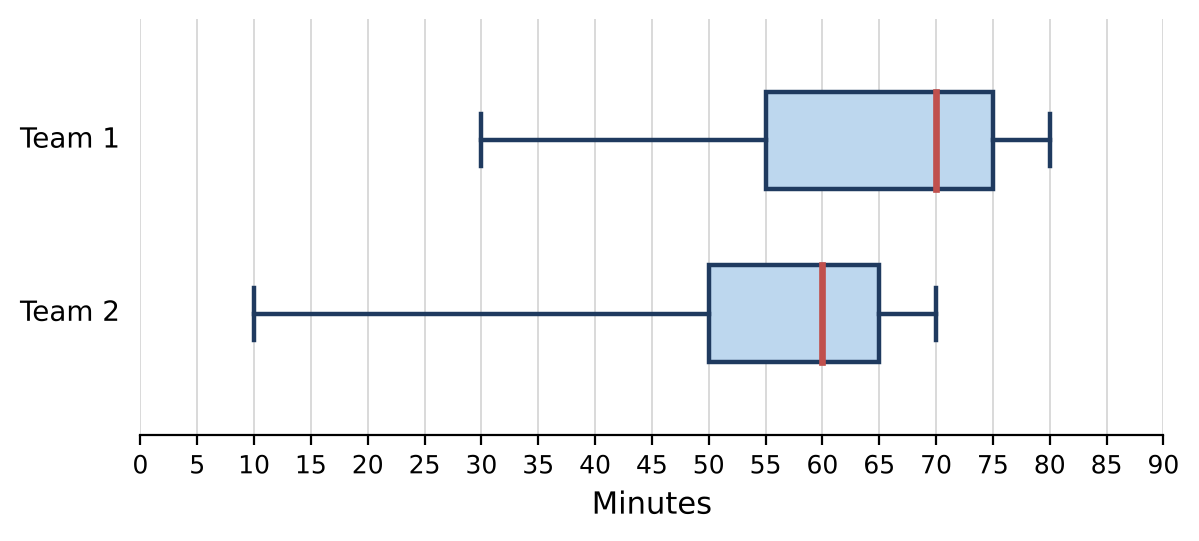
- The median of Team 1 is 70 and the median of Team 2 is 60.
- The difference is 70 − 60 = 10.
- A (−10): compared the ranges
- B (5): compared the Q1 values
- D (130): added the medians
Percentiles
Method. Percent below = (number below ÷ total) × 100.
Worked example- Order the values.
- Exactly 13 values are less than 84.
- Out of 20 values, that is 13 ÷ 20 × 100 = 65%.
- A (13%): gave the count, not the percent
- B (30%): found the percent above it
- D (70%): counted the value itself as below it
Histograms
Method. Find the middle position, then add bar heights from the left until you pass it.
Worked example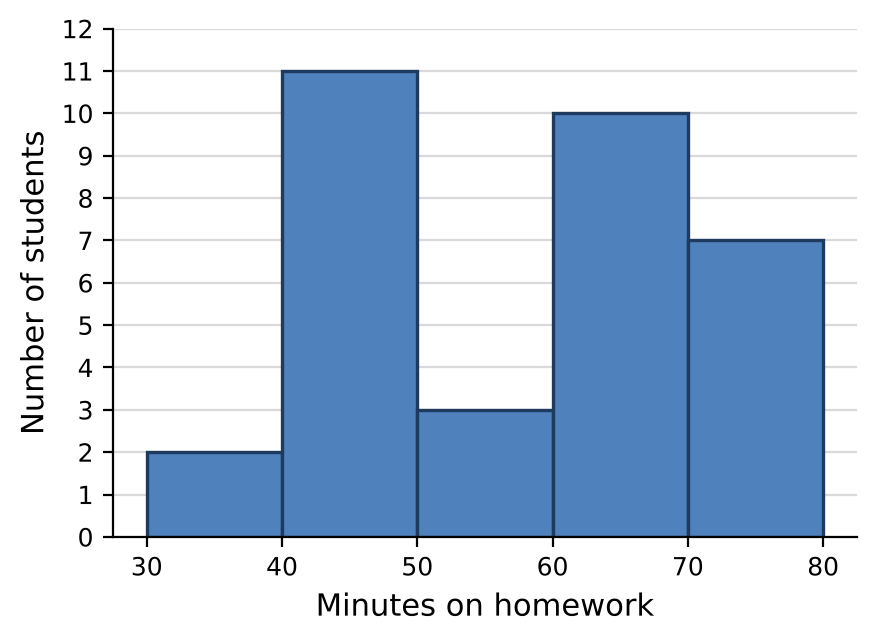
- With 33 values, the median is value number 17.
- The running totals of the bars are 2, 13, 16, 26, 33.
- The total first reaches 17 in the bar from 60 to 70.
- A (40 to 50): chose the tallest bar
- B (50 to 60): chose the middle interval on the scale
- D (70 to 80): miscounted the position of the middle value by a bar
Dot Plots, Bar Graphs and Tables
Count each dot or bar carefully and read the scale before computing a mean or median from a display.
Key formulas| Mean from a frequency display |
Bar graphs
Method. Percent change = (new − old) ÷ old × 100; always divide by the earlier year.
Worked example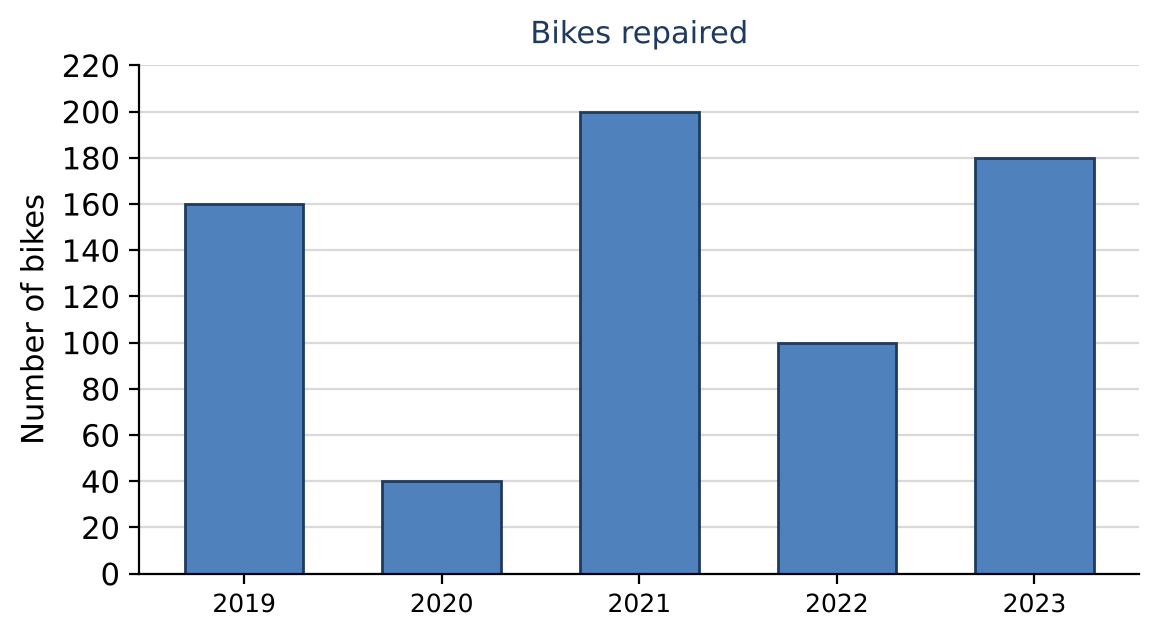
- Read the graph.
- So 2020 = 40 and 2022 = 100.
- The change is 60.
- Percent increase = change ÷ original × 100 = 60 ÷ 40 × 100 = 150%.
- A (40%): gave the original value as a percent of the new value
- B (60%): divided by the new value instead of the original
- D (250%): gave the new value as a percent of the original
03.04 Two-Variable Data: Models and Scatterplots
Problem-Solving and Data Analysis is about 15% of SAT Math (5–7 of 44 questions). This topic covers two-variable data: scatterplots and association, lines and curves of best fit, interpreting the slope and intercept of a model, predicting with a model, residuals, and linear versus exponential models.
Scatterplots and Models
Describe direction and strength of the association. A line of fit ŷ = a + bx predicts y from x: b is the predicted change in y for each 1-unit increase in x, and a is the predicted y when x = 0. Constant percent change calls for an exponential model.
Key formulas| Line of fit | |
| Residual | |
| Exponential model | |
| Strength |
Scatterplots and association
Method. Compare each point with the line directly above or below it.
Worked example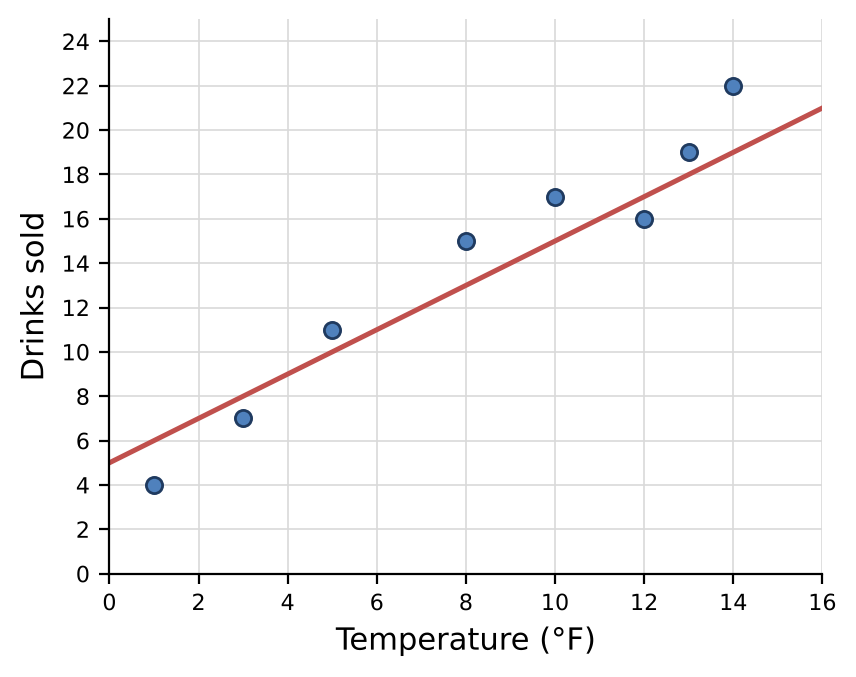
- A point is above the line when its y-value is greater than the line's y-value at the same x.
- Checking each of the 8 points, 5 are above and 3 are below.
- So 5 points lie above the line.
- A (3): counted the points below the line
- B (4): counted the points on the right half
- D (8): counted every point
Interpreting a line of fit
Method. Slope = predicted change per 1 unit of x; intercept = prediction at x = 0.
Worked example- The y-intercept is the predicted y when x = 0.
- So the intercept means “When minutes of practice is 0, the predicted points scored is 43”.
- A (For each additional unit of minutes of practice, the predicted points scored increases by 4.): described the slope instead of the intercept
- B (When minutes of practice is 0, the predicted points scored is 4.): used the slope as the starting value
- C (When points scored is 0, the predicted minutes of practice is 43.): reversed the roles of x and y
Residuals
Method. Residual = actual − predicted; positive means the point is above the line.
Worked example- The predicted value is ŷ = 0.5 × 9 + 13 = 17.5.
- Residual = actual − predicted = 14 − 17.5 = −3.5.
- B (3.5): subtracted in the wrong order (predicted − actual)
- C (14): gave the actual value
- D (17.5): gave the predicted value
Predicting with a Line of Best Fit
Substitute the x-value into the equation of the line of best fit; the result is a prediction, not an exact value.
Key formulas| Prediction |
Predicting with a line of best fit
Method. Plug the x-value into the regression equation.
Worked example- Substitute x = 33 into the line of best fit.
- ŷ = 5(33) + 7.
- ŷ = 165 + 7.
- So ŷ = 172.
- A (5.2): solved for x instead of predicting y
- B (165): forgot the intercept
- D (236): swapped the slope and the intercept
Line Graphs
A line graph shows change over time; the steepest segment is the fastest change.
Key formulas| Rate of change |
Line graphs
Method. Percent change = (new − old) ÷ old × 100; always divide by the earlier year.
Worked example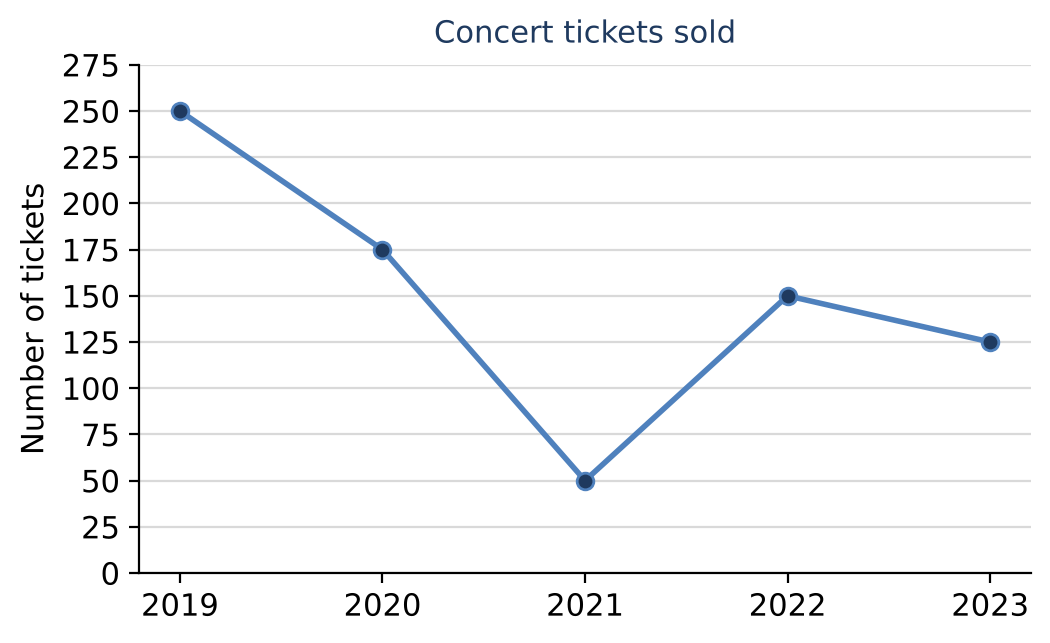
- Read the graph.
- So 2019 = 250 and 2021 = 50.
- The change is 200.
- Percent decrease = change ÷ original × 100 = 200 ÷ 250 × 100 = 80%.
- A (20%): gave the new value as a percent of the original
- C (200%): gave the change, not the percent change
- D (400%): divided by the new value instead of the original
03.05 Probability and Conditional Probability
Problem-Solving and Data Analysis is about 15% of SAT Math (5–7 of 44 questions). This topic covers probability: favorable over total outcomes, the complement, probabilities from two-way tables, conditional probability (restrict to one row or column), independence, and expected counts.
Probability
Probability is favorable outcomes over equally likely total outcomes. For a conditional probability, restrict to the given row or column of a table. The expected count is the probability times the number of trials.
Key formulas| Basic | |
| Complement | |
| Addition | |
| Independent | |
| Conditional | |
| Expected count |
Compound events
Method. Independent “and” → multiply the probabilities.
Worked example- The two results are independent.
- So multiply.
- P(heads) = and P(a 1) = .
- So P(both) = × = .
- B (): used only the second event
- C (): used only the first event
- D (): added the probabilities
Addition rule
Method. Add the two probabilities, then subtract the overlap once.
Worked example- Add P(A) and P(B).
- Then subtract the overlap P(A and B) once.
- So 0.3 + 0.25 − 0.2 = 0.35.
- A (0.075): multiplied the probabilities
- C (0.55): did not subtract the overlap
- D (0.65): found the probability of neither
Expected counts
Method. Expected count = probability × number of spins.
Worked example- P(green) = .
- Multiply by the number of spins.
- So × 75 = 40.
- A (): gave the probability, not the count
- B (25): treated the three colors as equally likely
- C (35): found the expected number of non-green results
Conditional probability and two-way tables
Method. “Given” or “from those in” → divide by that group's total; “and” → one cell ÷ grand total.
Worked example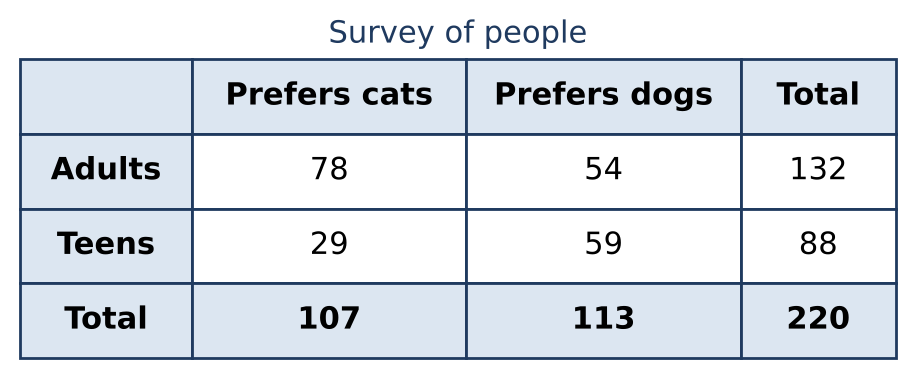
- Only the Prefers cats column counts.
- So the total is 107.
- Of these, 78 are in the Adults row.
- So the probability is .
- A (): divided by the grand total
- B (): found P(Prefers cats) instead
- C (): divided by the Adults row total
Conditional probability formula
Method. P(A | B) = P(A and B) ÷ P(B): divide by the probability of the given event.
Worked example- P(A | B) means divide P(A and B) by P(B).
- So 0.2 ÷ 0.3 = .
- A (): multiplied instead of dividing
- B (): gave P(A and B)
- C (): divided by P(A) instead of P(B)
Complement rule
Method. P(at least one) = 1 − P(none).
Worked example- “At least one” is the complement of “none”.
- P(none) = = = .
- So P(at least one) = 1 − = .
- B (): found the probability that none succeed
- C (): multiplied the probability by the number of tries
- D (): subtracted the all-succeed probability from 1
Two-Way Tables
Each cell counts members of a row group and a column group. For "given" questions divide by the row or column total, not the grand total.
Key formulas| Joint | |
| Conditional |
Two-way tables
Method. Of those who … → divide by that group's total.
Worked example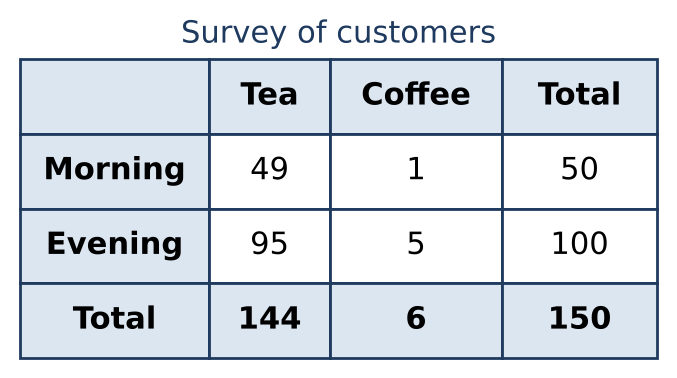
- The group is everyone in the Tea column.
- So divide by that column total, 144.
- Then 95 ÷ 144 = .
- B (): used the Coffee column
- C (): divided by the Evening row total
- D (): found the fraction of all customers in the Tea column
03.06 Inference from Samples and Margin of Error
Problem-Solving and Data Analysis is about 15% of SAT Math (5–7 of 44 questions). This topic covers estimating a population value from a random sample, and what a margin of error and a plausible interval mean. Larger random samples give smaller margins of error.
Inference and Margin of Error
A random sample's proportion or mean estimates the population value; multiply a sample proportion by the population size to estimate a count. The margin of error gives an interval of plausible values; larger samples give smaller margins of error.
Key formulas| Estimate a count | |
| Plausible interval | |
| Sample size |
Inference from a random sample
Method. Estimate = sample proportion × population size.
Worked example- In the sample, = 51% use public transit.
- A random sample represents the population.
- So estimate × 400 = 204.
- A (51): scaled the wrong way
- B (102): gave the sample count
- C (196): estimated the number who do not
Margin of error
Method. Plausible values = estimate ± margin of error.
Worked example- The plausible values are the sample percent ± the margin of error, from 30 − 2 = 28% to 30 + 2 = 32%.
- So the answer is 28%.
- A (26%): doubled the margin of error
- C (30%): gave the sample percent
- D (32%): found the other end of the interval
03.07 Evaluating Statistical Claims
Problem-Solving and Data Analysis is about 15% of SAT Math (5–7 of 44 questions). This topic covers evaluating statistical claims: random sampling allows conclusions about the population sampled, random assignment allows cause-and-effect conclusions, and observational studies show only association. Watch for bias and for conclusions that go beyond the data.
Evaluating Statistical Claims
Only random sampling lets you generalize to the population that was sampled; only random assignment to treatments lets you conclude cause and effect. Observational studies show association only. Convenience and voluntary samples are biased.
Key formulas| Random sample | |
| Random assignment | |
| Observational study |
Random sampling
Method. Random = chosen by chance from a list of everyone; not volunteers, not whoever is nearby.
Worked example- In a random sample every member of the population has the same chance of being chosen.
- Only numbering everyone on a complete list and choosing by a random number generator does that.
- The other methods let people choose themselves, pick whoever is handy, or leave out part of the population.
- A (Ask 40 employees chosen from the members of one club only.): chose a sample from only one part of the population
- C (Post an online survey and use the first 40 employees who choose to respond.): chose a voluntary response sample
- D (Ask 40 employees who are friends of the person running the survey.): chose a sample of acquaintances, which is not random
Scope of conclusions
Method. Random sampling → generalize; random assignment → cause and effect.
Worked example- Random sampling allows generalizing to the population that was sampled, all voters in the district.
- Random assignment allows cause-and-effect conclusions.
- Here the voters were randomly selected, but each voter chose his or her own routine (no random assignment).
- So the result can be generalized to all voters in the district, but cause and effect cannot be concluded.
- B (Cause and effect can be concluded, and the result can be generalized to all voters in the district.): thought there was random assignment
- C (Cause and effect can be concluded only for the subjects in the study.): missed the random sampling and thought there was random assignment
- D (Neither cause and effect nor generalization to all voters in the district is justified.): missed the random sampling