Data: Practice Paper 1
Choose one answer for each question, then select Check my answers. Every question has a full worked solution.
1.
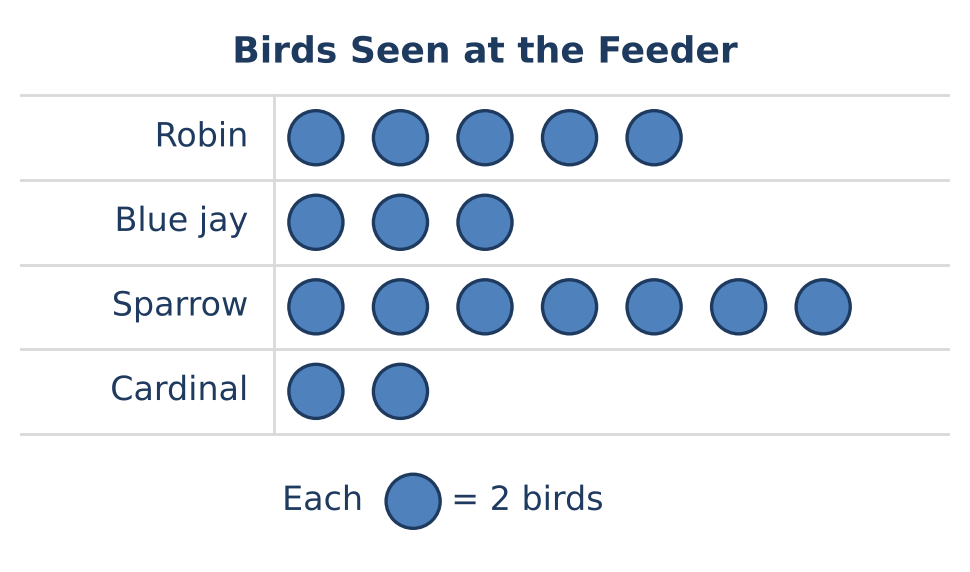
The pictograph shows the birds Mia saw at a bird feeder. How many more sparrows than robins did she see?
Show solution
AnswerB — 4
Step-by-step
- Sparrows: 7 symbols × 2 = 14 birds. Robins: 5 symbols × 2 = 10 birds.
- 14 − 10 = 4 more sparrows.
Fast methodThe sparrow row has 2 more symbols; 2 × 2 = 4.
Quick check10 + 4 = 14 ✓
Why the other choices are wrong
- A (2): counted the difference in symbols without using the key
- C (10): gave the number of robins
- D (14): gave the number of sparrows
- E (24): added the sparrows and robins
2.
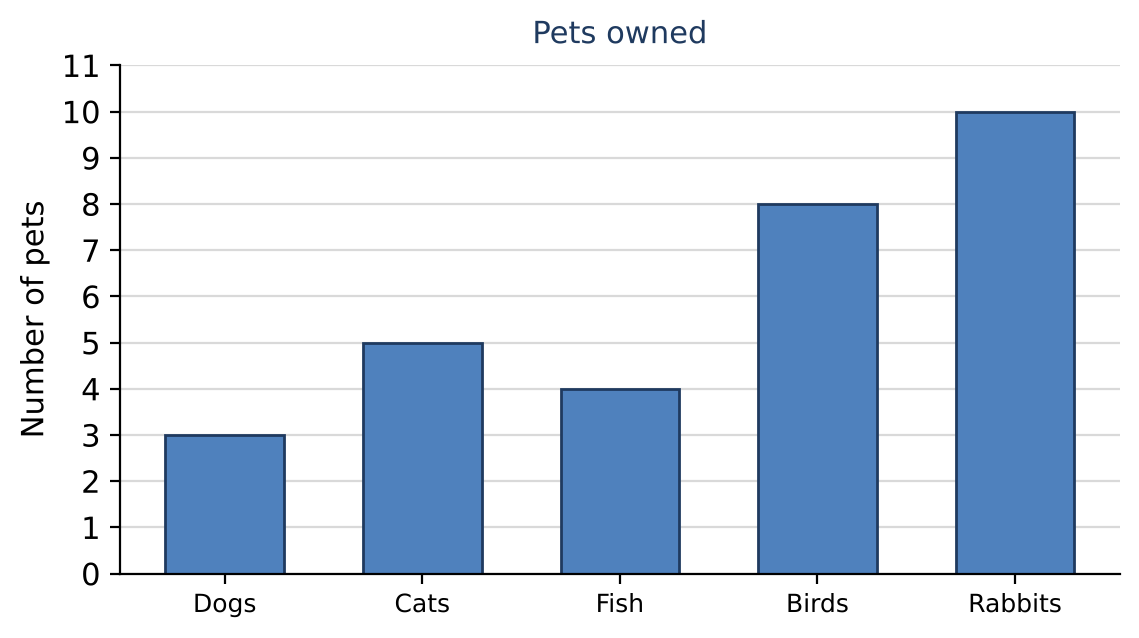
The bar graph shows pets owned. What is the difference between the greatest and the least number of pets shown?
Show solution
AnswerB — 7
Step-by-step
- The tallest bar is Rabbits with 10.
- The shortest bar is Dogs with 3.
- The difference is 10 − 3 = 7.
Fast methodFind the tallest and shortest bars, then subtract.
Quick check3 + 7 = 10, the height of the tallest bar ✓.
Why the other choices are wrong
- A (3): gave the shortest bar only
- C (8): counted on from 3 to 10 and included 3: 3, 4, 5, 6, 7, 8, 9, 10 is 8 numbers
- D (10): gave the tallest bar only
- E (13): added the tallest and shortest bars
3.
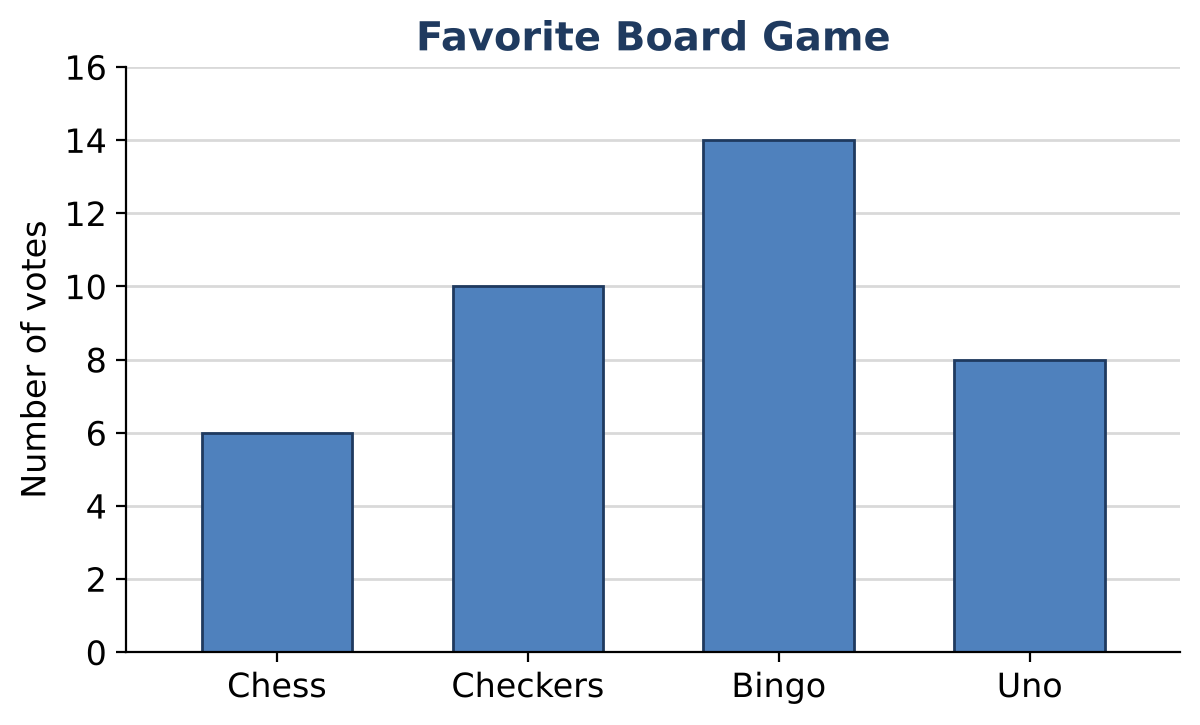
The bar graph shows students' votes for their favorite board game. How many students voted for Bingo?
Show solution
AnswerE — 14
Step-by-step
- Find the Bingo bar.
- The top of the bar lines up with 14, so 14 students voted for Bingo.
Fast methodFollow the top of the Bingo bar across to the scale.
Quick checkThe Bingo bar is one grid line (2 votes) below 16 ✓
Why the other choices are wrong
- A (6): read the Chess bar
- B (8): read the Uno bar
- C (10): read the Checkers bar
- D (12): read the grid line just below the top of the bar
4.
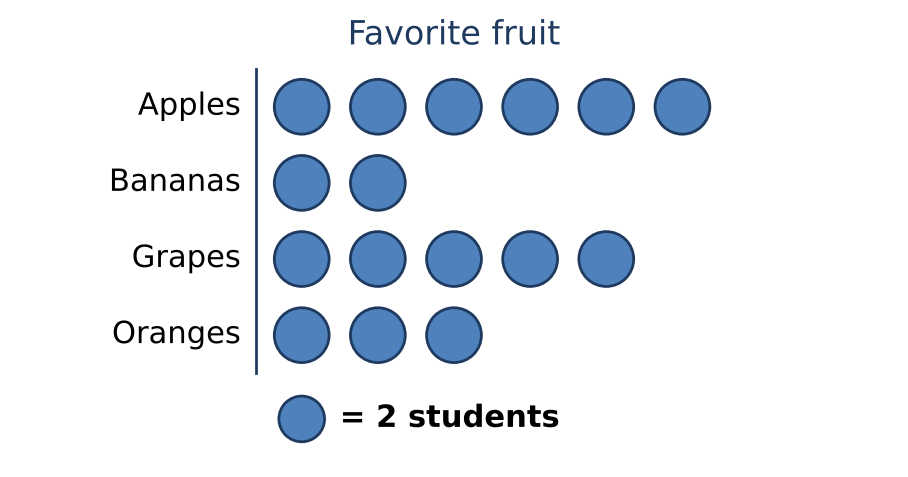
The pictograph shows favorite fruit. Each symbol stands for 2 students. How many students are shown in all?
Show solution
AnswerC — 32
Step-by-step
- Add the symbols.
- So 6 + 2 + 5 + 3 = 16.
- Multiply by the key.
- So 16 × 2 = 32.
Fast methodCount the symbols first, then multiply once by the key.
Quick checkadding the rows one at a time, 12 + 4 + 10 + 6 = 32 ✓.
Why the other choices are wrong
- A (16): added the symbols without using the key
- B (20): left out Apples
- D (34): counted one symbol too many
- E (48): used 3 students for each symbol: 16 × 3 = 48
5.
A bag holds 15 purple marbles and no yellow marbles. One marble is picked at random. How likely is it that the marble is purple?
Show solution
AnswerE — certain
Step-by-step
- The probability of purple is = 1.
- A probability of 1 means certain.
Fast method0 = impossible, below = unlikely, = equally likely, above = likely, 1 = certain.
Quick check15 of the 15 marbles are purple, which places the chance at 1 on the 0-to-1 scale ✓.
Why the other choices are wrong
- A (impossible): thought an event that must happen cannot happen
- B (unlikely): thought the chance is below one half
- C (equally likely as not): thought the chance is exactly one half
- D (likely): thought the chance is above one half but not certain
6.
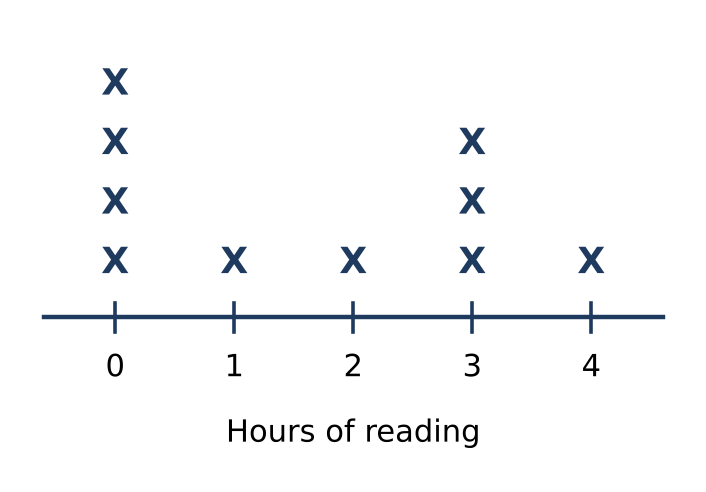
The line plot shows the number of hours for some students. Each X stands for one of the students. How many students are shown in all?
Show solution
AnswerC — 10
Step-by-step
- Each X is one of the students.
- Add the X's in every column.
- So 4 + 1 + 1 + 3 + 1 = 10.
Fast methodCount every X; the numbers on the line are not the count.
Quick checkcounting the X's column by column again gives 10 ✓.
Why the other choices are wrong
- A (5): counted the columns instead of the X's
- B (6): left out the column for 0
- D (11): counted one X twice: 10 + 1 = 11
- E (16): added up the hours instead of the students
7.
Jen is making a bar graph of push-ups. On her graph, each grid line is 5 push-ups more than the grid line below it, starting from 0. Jen did 35 push-ups. Her bar should reach which grid line above 0?
Show solution
AnswerC — the 7th
Step-by-step
- Count by 5s: 5, 10, 15, 20, 25, 30, 35.
- 35 is the 7th number when counting by 5s, so the bar reaches the 7th grid line above 0.
Fast method35 ÷ 5 = 7.
Quick check7 grid lines × 5 push-ups = 35 push-ups ✓
Why the other choices are wrong
- A (the 5th): used the scale number, 5
- B (the 6th): stopped counting by 5s at 30
- D (the 30th): subtracted 5 from 35
- E (the 35th): used one grid line for each push-up
8.
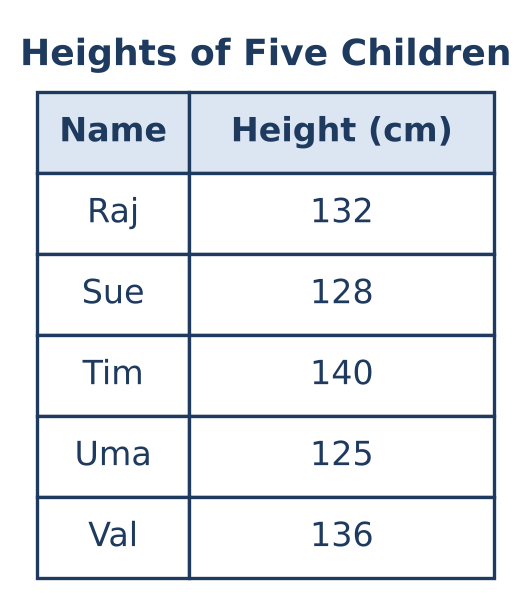
The table shows the heights of five children. The children line up from shortest to tallest. Who is in the middle of the line?
Show solution
AnswerA — Raj
Step-by-step
- Order the heights from least to greatest: Uma 125, Sue 128, Raj 132, Val 136, Tim 140.
- With 5 children, the middle one is 3rd in line.
- The 3rd child is Raj.
Fast methodCross off the shortest and tallest, then the next shortest and tallest; Raj is left.
Quick checkTwo children (Uma, Sue) are shorter than Raj and two (Val, Tim) are taller ✓
Why the other choices are wrong
- B (Sue): counted from the shortest and stopped at the second child
- C (Tim): picked the child in the middle row of the table
- D (Uma): picked the shortest child
- E (Val): counted from the tallest and stopped at the second child
9.
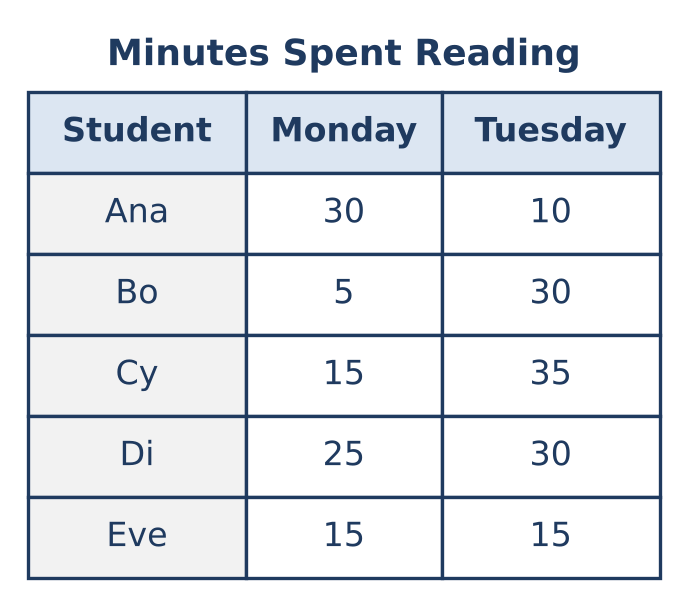
The table shows how many minutes five students spent reading on Monday and on Tuesday. Which student read for the most minutes in all on the two days?
Show solution
AnswerD — Di
Step-by-step
- Add each student's two days: Ana 30 + 10 = 40, Bo 5 + 30 = 35, Cy 15 + 35 = 50.
- Di 25 + 30 = 55, Eve 15 + 15 = 30.
- The greatest total is 55 minutes, so Di read the most.
Fast methodAdd across each row and compare the totals.
Quick checkDi's 55 minutes is more than Cy's 50, Ana's 40, Bo's 35, and Eve's 30 ✓
Why the other choices are wrong
- A (Ana): looked only at Monday
- B (Bo): picked the student whose minutes went up the most from Monday to Tuesday
- C (Cy): looked only at Tuesday
- E (Eve): picked the student who read the fewest minutes in all
10.
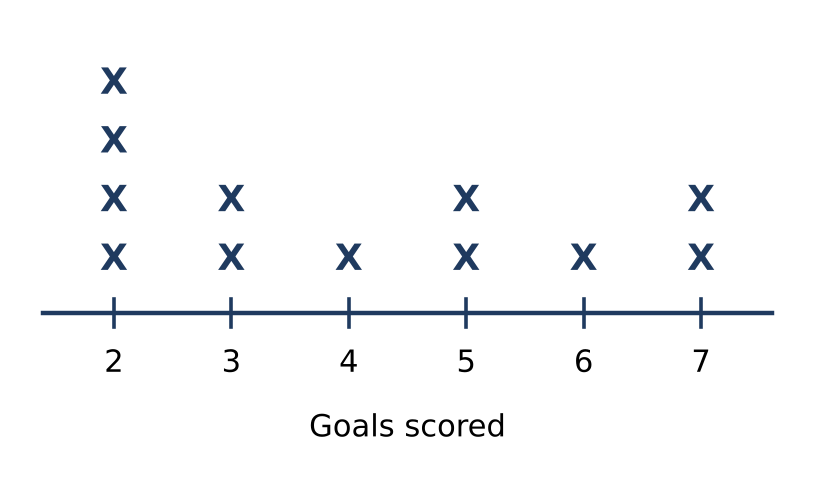
The line plot shows goals scored for some games. Each X is one of the games. What is the mode of the data?
Show solution
AnswerA — 2
Step-by-step
- The mode is the value with the most X's.
- The column for 2 has 4 X's, more than any other column.
- So the mode is 2.
Fast methodOn a line plot the mode is under the tallest stack.
Quick checkevery other column has fewer than 4 X's ✓.
Why the other choices are wrong
- B (3): chose 3, the first of the columns with 2 X's (a next-tallest stack) instead of the tallest
- C (4): gave the number of X's in the tallest column
- D (7): gave the greatest value with an X
- E (8): found the total goals for the tallest column: 2 × 4 = 8
11.
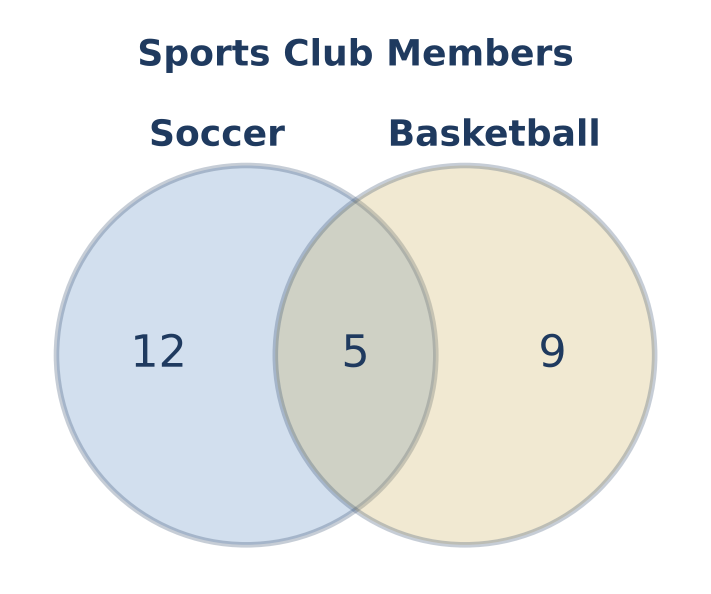
The diagram shows the students in a sports club who play soccer, basketball, or both. How many students play only one of the two sports?
Show solution
AnswerD — 21
Step-by-step
- The 12 in the soccer circle only are students who play only soccer.
- The 9 in the basketball circle only are students who play only basketball.
- The 5 in the middle play both, so they are not counted. 12 + 9 = 21.
Fast methodAdd the two outside parts of the circles.
Quick check21 students play one sport and 5 play both: 21 + 5 = 26 students in the club ✓
Why the other choices are wrong
- A (5): gave the number who play both sports
- B (14): gave everyone who plays basketball
- C (17): gave everyone who plays soccer
- E (26): counted every student in the club
12.
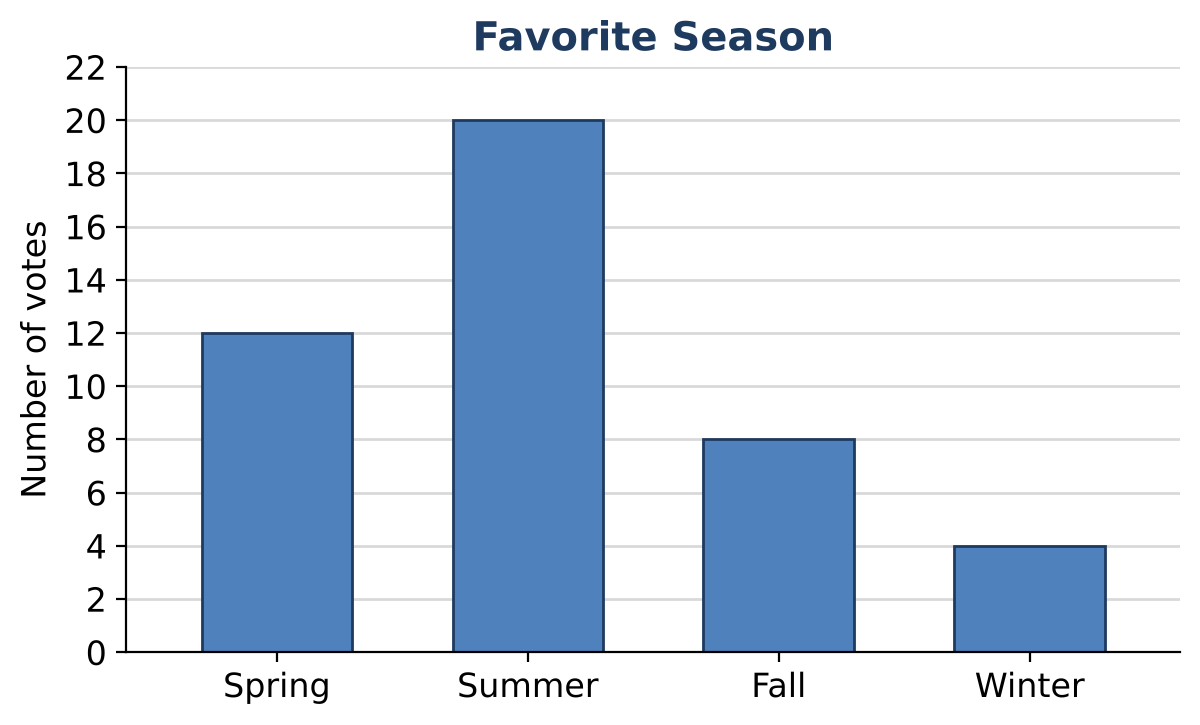
The bar graph shows students' votes for their favorite season. Which two seasons together got the same number of votes as summer?
Show solution
AnswerE — Spring and Fall
Step-by-step
- Read the bars: spring 12, summer 20, fall 8, winter 4.
- Look for two other seasons that add to 20: 12 + 8 = 20.
- So spring and fall together equal summer.
Fast methodSummer − spring = 20 − 12 = 8, and fall has 8.
Quick check12 + 8 = 20 ✓
Why the other choices are wrong
- A (Fall and Winter): found the pair that equals spring (8 + 4 = 12) instead of summer
- B (Spring and Winter): read winter's bar as 8
- C (Summer and Winter): included summer itself
- D (Spring and Summer): picked the two tallest bars
13.
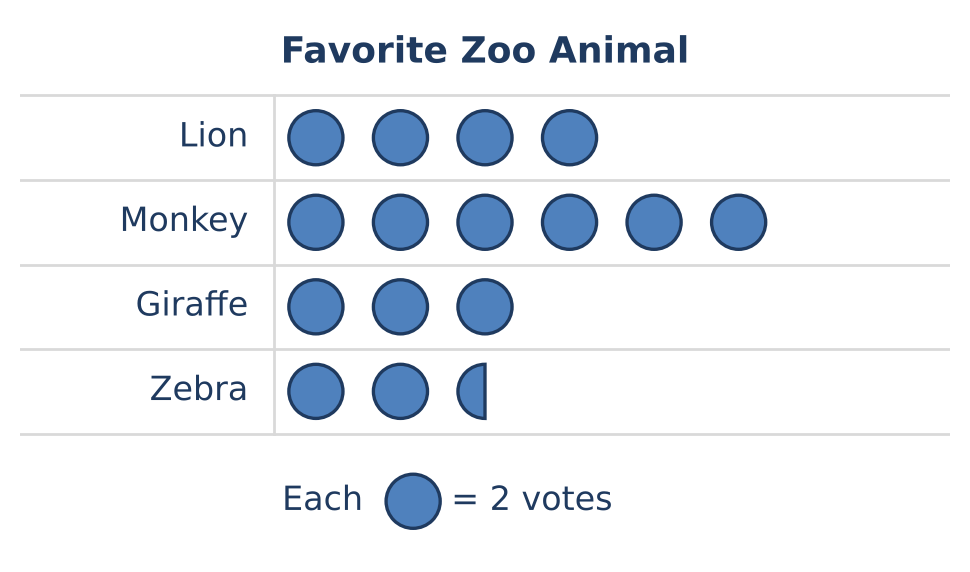
The pictograph shows students' votes for their favorite zoo animal. If 6 more students vote for the giraffe, how many symbols will be in the giraffe row?
Show solution
AnswerB — 6
Step-by-step
- Each symbol stands for 2 votes. The giraffe row has 3 symbols, which is 6 votes.
- With 6 more votes, the giraffe has 6 + 6 = 12 votes.
- 12 ÷ 2 = 6 symbols.
Fast method6 new votes is 6 ÷ 2 = 3 more symbols: 3 + 3 = 6.
Quick check6 symbols × 2 votes = 12 votes = 6 old votes + 6 new votes ✓
Why the other choices are wrong
- A (4): added only one symbol for the 6 new votes
- C (9): added one symbol for each new vote
- D (12): gave the number of votes instead of symbols
- E (18): multiplied 3 × 6
14.
A class makes a pictograph of votes for a new class mascot. Each ★ stands for 4 votes. How many ★ symbols should be drawn to show 14 votes?
Show solution
AnswerA — 3
Step-by-step
- 14 ÷ 4 = 3 with 2 left over.
- 3 whole symbols show 12 votes.
- The 2 left over votes are half of 4, so draw half a symbol: 3 symbols.
Fast method12 votes is 3 symbols; 2 more votes is half a symbol.
Quick check3 × 4 + 2 = 14 votes ✓
Why the other choices are wrong
- B (4): rounded up to a whole symbol
- C (7): divided 14 by 2
- D (10): subtracted 4 from 14
- E (14): drew one symbol for each vote
15.
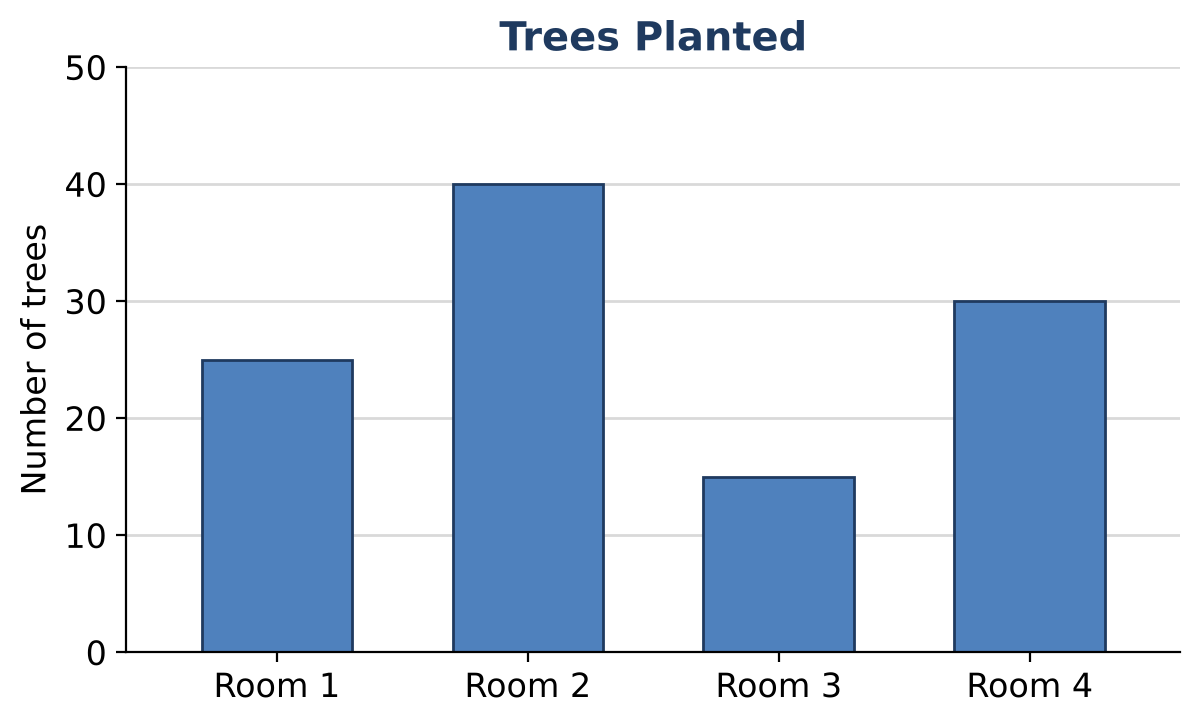
The bar graph shows how many trees four classrooms planted. How many trees did the four classrooms plant in all?
Show solution
AnswerE — 110
Step-by-step
- Each grid line is 10 more than the one below it, so a bar halfway between two lines shows a number ending in 5.
- Room 1: 25. Room 2: 40. Room 3: 15. Room 4: 30.
- 25 + 40 + 15 + 30 = 110 trees.
Fast methodPair the halfway bars: 25 + 15 = 40; then 40 + 40 + 30 = 110.
Quick checkRoom 1 and Room 3 together (40) match Room 2, so the total is 40 + 40 + 30 = 110 ✓
Why the other choices are wrong
- A (85): left out Room 1
- B (95): left out Room 3
- C (100): read each bar that ends between grid lines at the line below
- D (105): read Room 3's bar as 10
16.
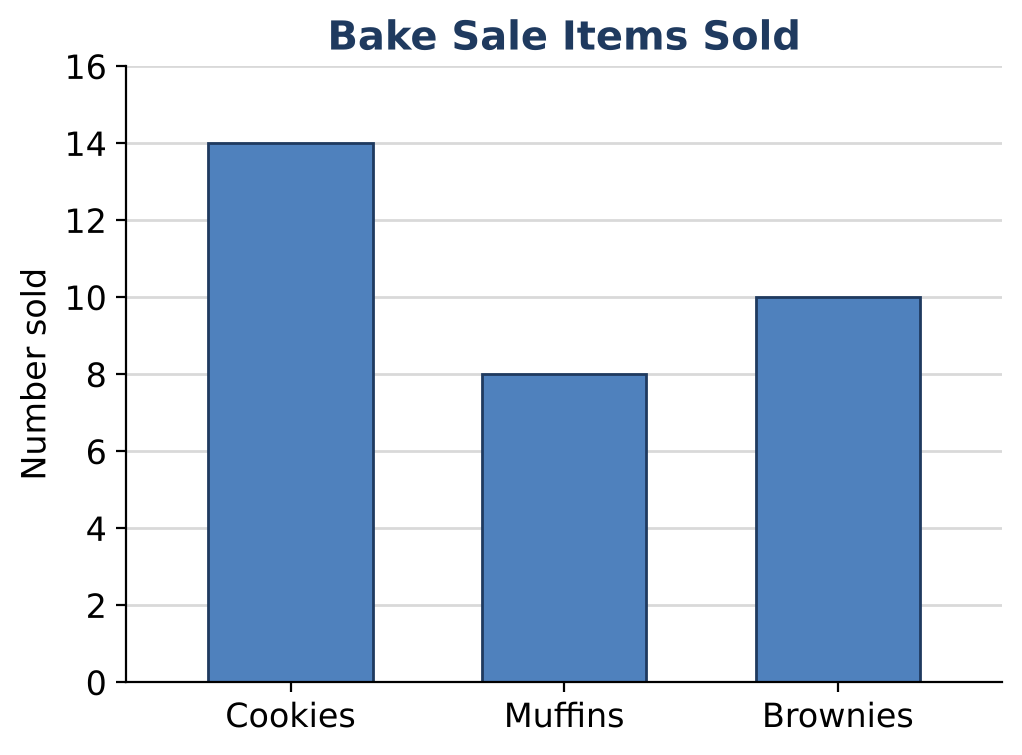
The bar graph shows how many of each item a class sold at a bake sale. Cookies cost $1 each, muffins cost $2 each, and brownies cost $3 each. How much money did the class make in all?
Show solution
AnswerC — $60
Step-by-step
- Read the bars: 14 cookies, 8 muffins, and 10 brownies.
- Cookies: 14 × $1 = $14. Muffins: 8 × $2 = $16. Brownies: 10 × $3 = $30.
- $14 + $16 + $30 = $60.
Fast methodFind the money for each bar, then add: 14 + 16 + 30 = 60.
Quick check$60 − $30 − $16 = $14, which is 14 cookies at $1 each ✓
Why the other choices are wrong
- A ($6): added the three prices, $1 + $2 + $3
- B ($32): counted the items sold, as if each cost $1
- D ($64): charged $2 for every item
- E ($96): charged $3 for every item
17.
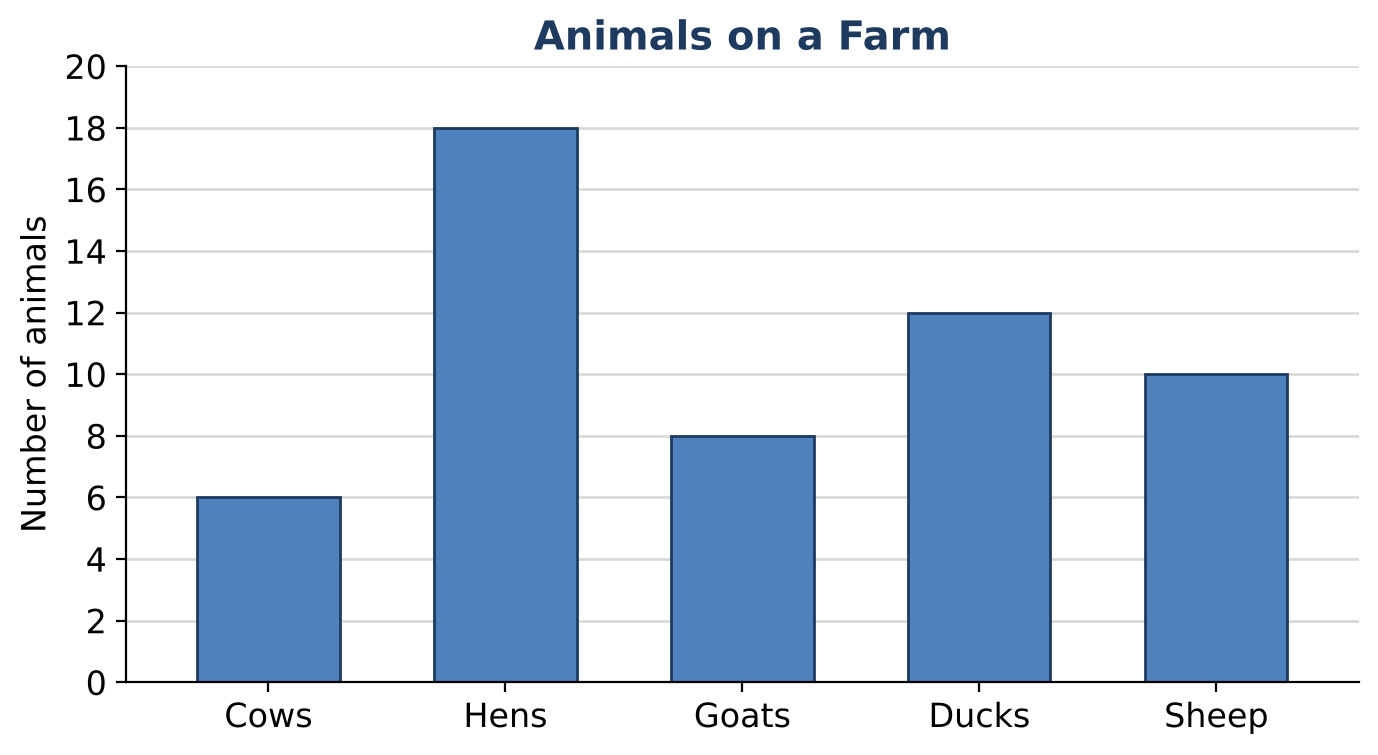
The bar graph shows the animals on a farm. Hens and ducks are birds. Cows, goats, and sheep have four legs. How many more birds than four-legged animals are on the farm?
Show solution
AnswerA — 6
Step-by-step
- Birds: hens 18 + ducks 12 = 30.
- Four-legged animals: cows 6 + goats 8 + sheep 10 = 24.
- 30 − 24 = 6 more birds.
Fast methodAdd each group's bars, then subtract the two group totals.
Quick check24 + 6 = 30, and 30 + 24 = 54 animals, the sum of all five bars ✓
Why the other choices are wrong
- B (12): compared the tallest bar with the shortest bar, 18 − 6
- C (24): gave the number of four-legged animals
- D (30): gave the number of birds
- E (54): added all the animals
18.
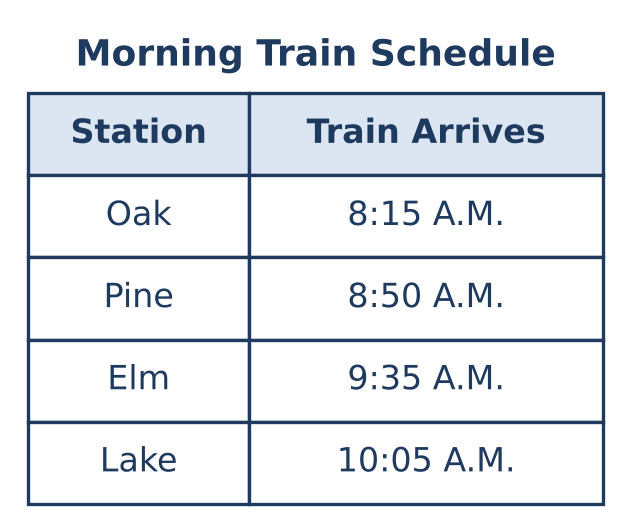
The table shows when a train arrives at each station. Ken gets on the train at Pine and gets off at Lake. How many minutes is Ken on the train?
Show solution
AnswerC — 75 minutes
Step-by-step
- The train is at Pine at 8:50 A.M. and at Lake at 10:05 A.M.
- From 8:50 to 9:00 is 10 minutes, from 9:00 to 10:00 is 60 minutes, and from 10:00 to 10:05 is 5 minutes.
- 10 + 60 + 5 = 75 minutes.
Fast methodCount up from 8:50: 10 minutes to 9:00, 1 hour to 10:00, 5 more minutes.
Quick check8:50 + 75 minutes = 8:50 + 1 hour 15 minutes = 10:05 ✓
Why the other choices are wrong
- A (30 minutes): found the time from Elm to Lake only
- B (45 minutes): found the time from Pine to Elm only
- D (110 minutes): started at Oak instead of Pine
- E (155 minutes): subtracted the times like whole numbers, 1005 − 850
19.
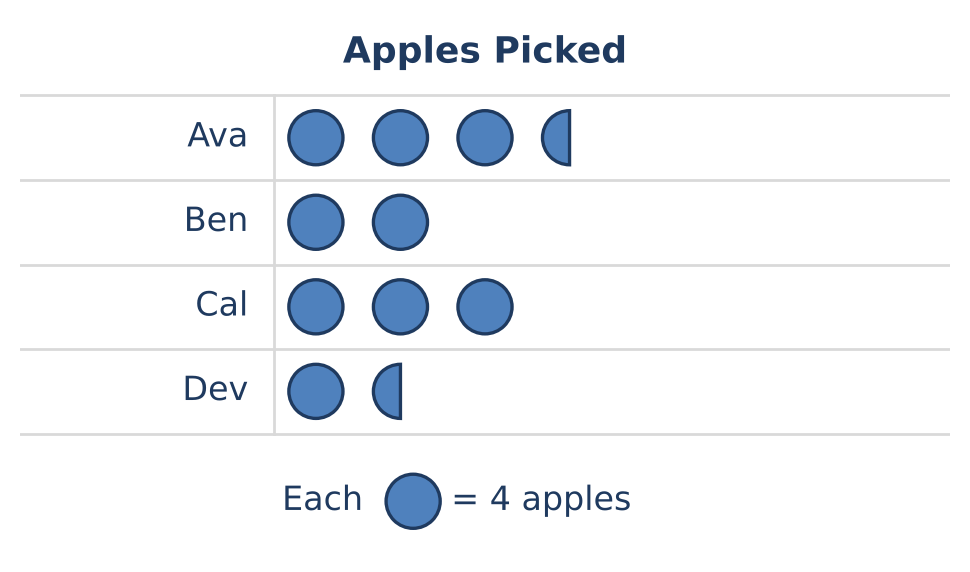
The pictograph shows how many apples four children picked. How many more apples did Ava and Ben pick together than Cal picked?
Show solution
AnswerC — 10
Step-by-step
- Each whole symbol stands for 4 apples, so a half symbol stands for 2 apples.
- Ava: 3 symbols = 12 + 2 = 14 apples. Ben: 2 symbols = 8 apples. Together: 14 + 8 = 22 apples.
- Cal: 3 symbols = 12 apples.
- 22 − 12 = 10 more apples.
Fast methodCompare symbols first: Ava and Ben have 5 symbols and Cal has 3, a difference of 2 symbols = 2 × 4 + 2 = 10 apples.
Quick checkCal's 12 + 10 = 22 = Ava's 14 + Ben's 8 ✓
Why the other choices are wrong
- A (2): compared only Ava with Cal
- B (5): used 2 apples for each symbol
- D (12): counted Ava's half symbol as a whole symbol
- E (22): found Ava and Ben together and did not subtract Cal's apples
20.
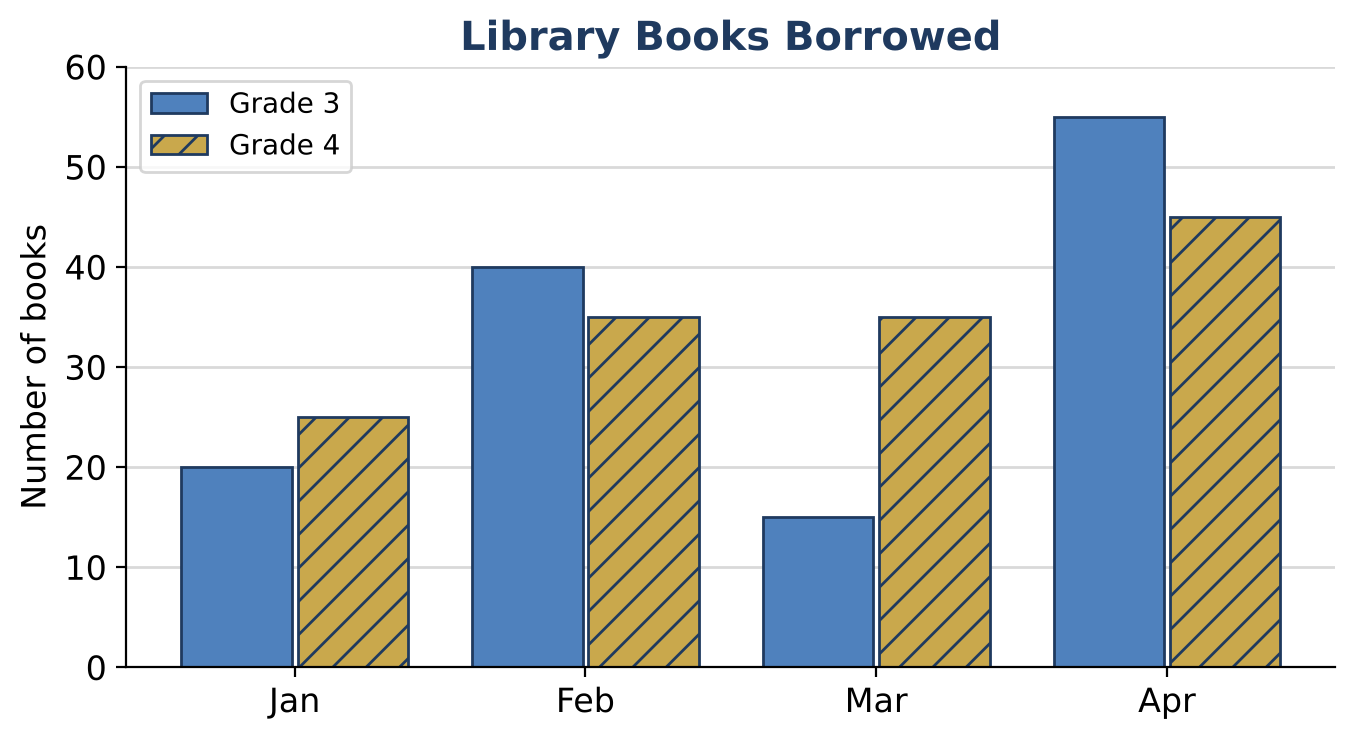
The double bar graph shows how many library books Grade 3 and Grade 4 borrowed each month. How many more books did the two grades borrow in all in April than in March?
Show solution
AnswerD — 50
Step-by-step
- April: Grade 3 borrowed 55 and Grade 4 borrowed 45, so 55 + 45 = 100 books.
- March: Grade 3 borrowed 15 and Grade 4 borrowed 35, so 15 + 35 = 50 books.
- 100 − 50 = 50 more books.
Fast methodAdd the two bars for each month, then subtract.
Quick check50 + 50 = 100 ✓
Why the other choices are wrong
- A (10): compared only the Grade 4 bars
- B (20): found the difference between the two grades in March
- C (40): compared only the Grade 3 bars
- E (100): gave the April total