Data: Study Guide
The Elementary Level SSAT (grades 3–4) has one 30-question Quantitative section, 30 minutes, with five answer choices and no calculator. There is no penalty for a wrong answer, so answer every question. This topic covers data: reading pictographs, bar graphs, tables and line plots, finding the mode, median and range of a small set of numbers, and describing how likely an event is.
Graphs and Tables
Read the title, the labels and the key before you read any values. In a pictograph, multiply the number of symbols by what one symbol stands for. In a bar graph, read across from the top of each bar to the scale.
Key formulas| Pictograph | |
| Half a symbol | |
| Bar graph | |
| Line plot | |
| Total | |
| How many more |
Pictographs
Method. Count the symbols first, then multiply once by the key.
Worked example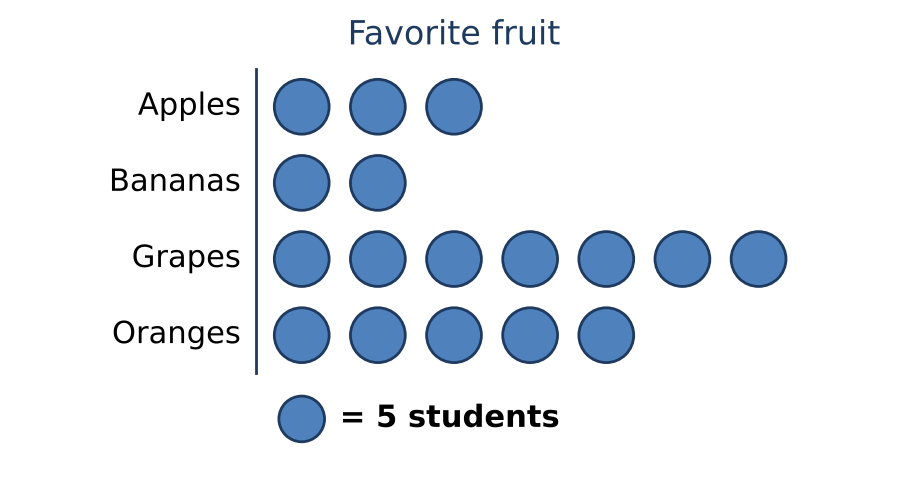
- Count the symbols for Oranges, which gives 5.
- Multiply by the key.
- So 5 × 5 = 25.
- A (5): counted the symbols without using the key
- B (15): read the row for Apples
- C (20): missed one symbol
- E (35): read the row for Grapes: 7 × 5 = 35
Bar graphs
Method. Find the tallest and shortest bars, then subtract.
Worked example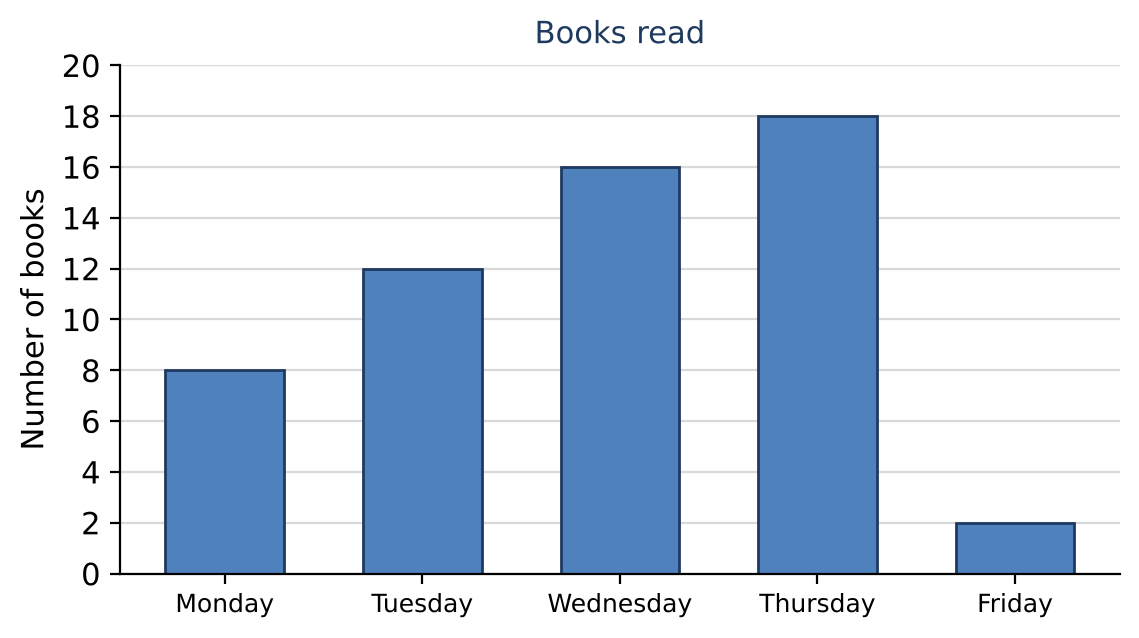
- The tallest bar is Thursday with 18.
- The shortest bar is Friday with 2.
- The difference is 18 − 2 = 16.
- A (2): gave the shortest bar only
- B (6): used the first and last bars (Monday and Friday): 8 − 2 = 6
- C (10): used the second-shortest bar
- D (14): used the second-tallest bar
Tables
Method. Add the rows, pairing numbers that make easy tens.
Worked example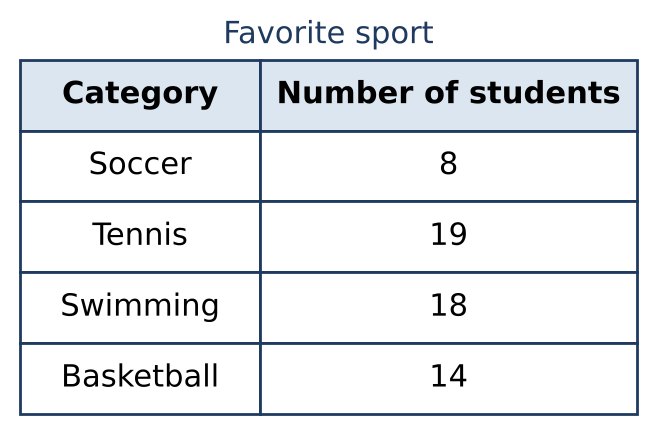
- Add every row.
- So 8 + 19 + 18 + 14 = 59.
- A (45): left out Basketball
- B (51): left out Soccer
- D (69): carried 3 tens instead of 2 from the ones column (8 + 9 + 8 + 4 = 29), giving 69
- E (78): added Tennis twice: 8 + 19 + 19 + 18 + 14 = 78
Line plots and dot plots
Method. Count every X; the numbers on the line are not the count.
Worked example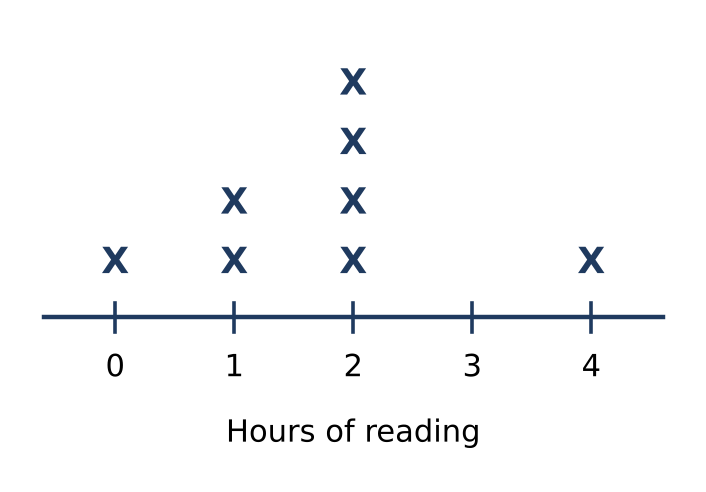
- Each X is one of the students.
- Add the X's in every column.
- So 1 + 2 + 4 + 0 + 1 = 8.
- A (5): counted the columns instead of the X's
- B (7): left out the column for 0
- D (10): added the numbers on the line: 0 + 1 + 2 + 3 + 4 = 10
- E (14): added up the hours instead of the students
Mode, Median and Range
The mode is the value that appears most often. The median is the middle value after you put the values in order. The range is the greatest value minus the least value.
Key formulas| Mode | |
| Median | |
| Range | |
| Example |
Mode
Method. On a line plot the mode is under the tallest stack.
Worked example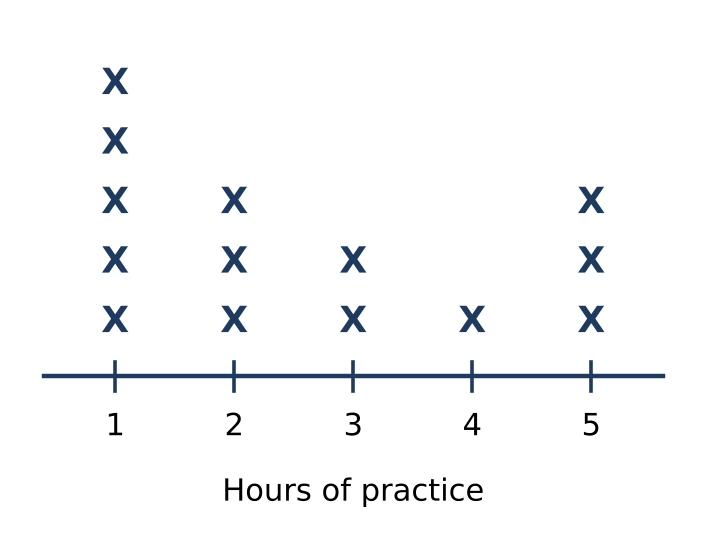
- The mode is the value with the most X's.
- The column for 1 has 5 X's, more than any other column.
- So the mode is 1.
- B (2): chose 2, the first of the columns with 3 X's (a next-tallest stack) instead of the tallest
- C (3): chose the middle value of the number line (1 to 5)
- D (4): gave the range
- E (5): gave the number of X's in the tallest column
Chance and Likelihood
Chance tells how likely something is to happen. Compare the number of objects of one kind with the total number of objects: if none are that kind it is impossible, and if all are that kind it is certain. The chance can be written as a fraction: the number of that kind over the total number.
Key formulas| Impossible | |
| Certain | |
| Likely | |
| Unlikely | |
| Equally likely | |
| Chance as a fraction | |
| Example |
Likelihood
Method. 0 = impossible, below = unlikely, = equally likely, above = likely, 1 = certain.
Worked example- The probability of green is = 1.
- A probability of 1 means certain.
- A (impossible): thought a possible event cannot happen
- B (unlikely): thought the chance is below one half
- C (likely): thought the chance is above one half but not certain
- E (equally likely as not): thought the chance is exactly one half