Data Analysis and Probability: Study Guide
The Middle Level SSAT (grades 5–7) has two 25-question Quantitative sections, 30 minutes each, with five answer choices and no calculator. A wrong answer loses ¼ point, so guess only after eliminating choices. This topic covers data and probability: mean, median, mode and range, reading tables, bar graphs, line graphs and circle graphs, and simple probability.
Mean, Median, Mode and Range
The mean, median and mode describe the center of a data set; the range (greatest minus least) describes how spread out it is. An outlier pulls the mean toward it but barely moves the median.
Key formulas| Mean | |
| Sum from the mean | |
| Median | |
| Median (even count) | |
| Mode | |
| Range | |
| Add k to every value |
Mean
Method. Mean = sum of the values ÷ how many values there are.
Worked example- Add the values.
- So 3 + 8 + 4 = 15.
- Divide by the number of values, 3.
- So the mean is 15 ÷ 3 = 5.
- A (3.5): averaged only the first and last values listed
- B (3.75): divided by one more than the count
- C (4): gave the median
- E (7.5): divided by one less than the count: 15 ÷ 2 = 7.5
Median
Method. Sort first; odd count → middle value, even count → mean of the two middle values.
Worked example- Order the values.
- So 2, 3, 17, 21, 22.
- There are 5 values.
- The middle one is value 3, which is 17.
- So the median is 17.
- A (3): gave the middle position instead of the value
- B (13): gave the mean
- D (20): gave the range: 22 − 2 = 20
- E (22): did not put the values in order first
Effect of outliers
Method. Find both means, then subtract; an outlier pulls the mean toward it.
Worked example- The mean with every value is 198 ÷ 6 = 33.
- The outlier is 88.
- Without it, the mean is 110 ÷ 5 = 22.
- The decrease is 33 − 22 = 11.
- A (0): found the change in the median
- C (22): gave the new mean
- D (33): gave the original mean
- E (88): gave the decrease in the total instead of in the mean: 198 − 110 = 88
Comparing data sets
Method. Find the median of each set separately, then subtract.
Worked example- Ordered, A is 39, 55, 63, 73, 74, 74.
- So its median is 68.
- Ordered, B is 4, 12, 42, 55, 66, 67.
- So its median is 48.5.
- The difference is 68 − 48.5 = 19.5.
- B (20): did not put the data in order before finding the medians: 68.5 − 48.5 = 20
- C (22): compared the means instead
- D (116.5): added the medians
- E (132): compared the sums
Graphs and Tables
Read the title, axes, scale and units before reading values. Bar graphs compare categories, line graphs show change over time, circle graphs show parts of a whole, and dot plots, stem-and-leaf plots and histograms show how data are spread.
Key formulas| Percent of whole | |
| Circle graph | |
| Change | |
| Stem-and-leaf | |
| Two-way table |
Line graphs
Method. Read both points on the scale, then subtract the smaller from the larger.
Worked example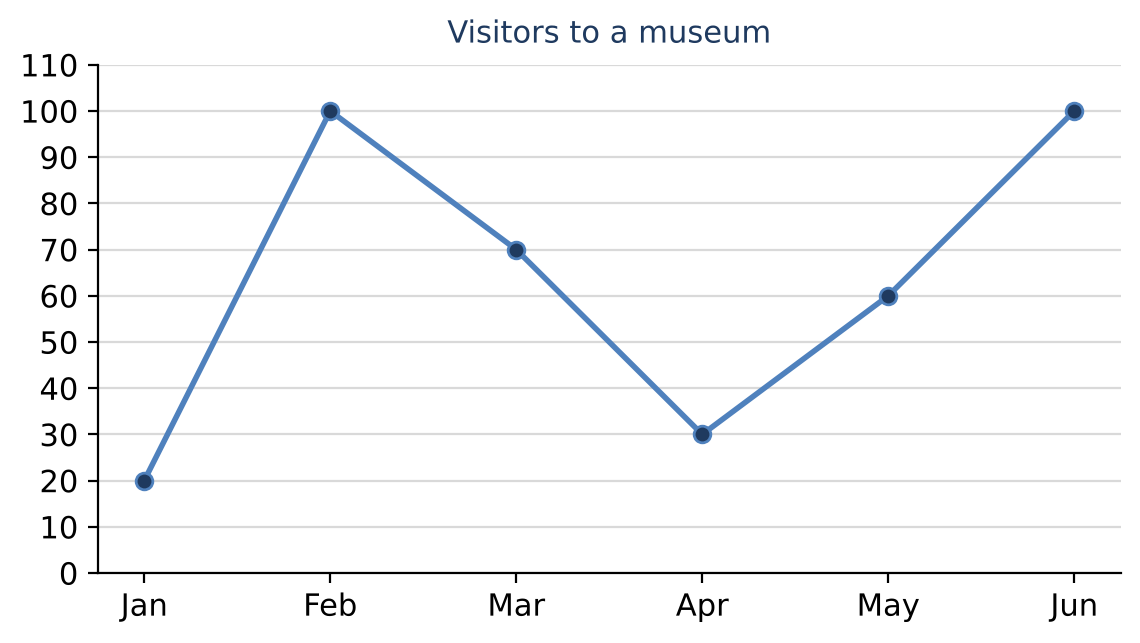
- Read the points.
- So February = 100 and March = 70.
- The decrease is 100 − 70 = 30.
- A (10): misread both points by one grid line toward each other: 90 − 80 = 10
- B (20): misread one point by one grid line the other way
- D (70): gave the March value
- E (100): gave the February value
Circle graphs
Method. Number = percent × total ÷ 100.
Worked example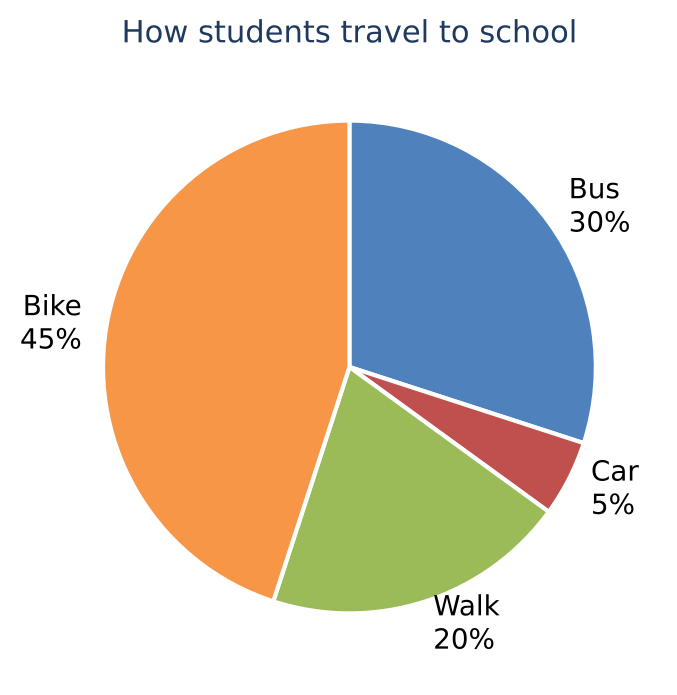
- The percents differ by 45% − 20% = 25%.
- Then 25% of 160 is × 160 = 40.
- A (25): subtracted the percents but did not find them of the total
- C (72): gave the number for Bike only
- D (90): took the percent difference of 360° instead of 160 students: 25% × 360 = 90
- E (104): added instead of subtracting
Line plots and dot plots
Method. Fraction = count that fits ÷ total count.
Worked example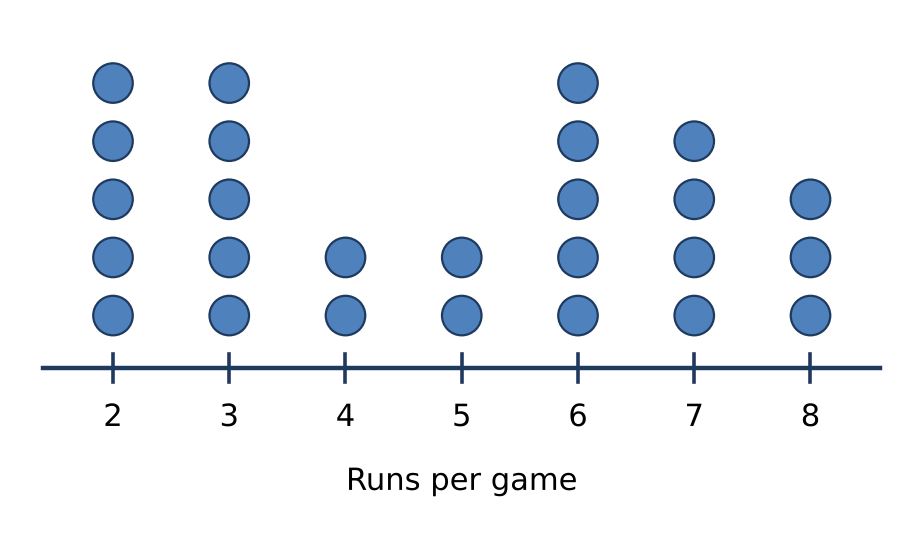
- At most 5 means 5 or less.
- There are 14 such dots out of 26 in all.
- So the fraction is = .
- A (): used only the dots at 5
- B (): used less than 5 instead of at most 5
- C (): counted one extra dot in the total
- E (): counted one dot too few in the total:
Histograms
Method. Add the heights of the bars from 30 onward.
Worked example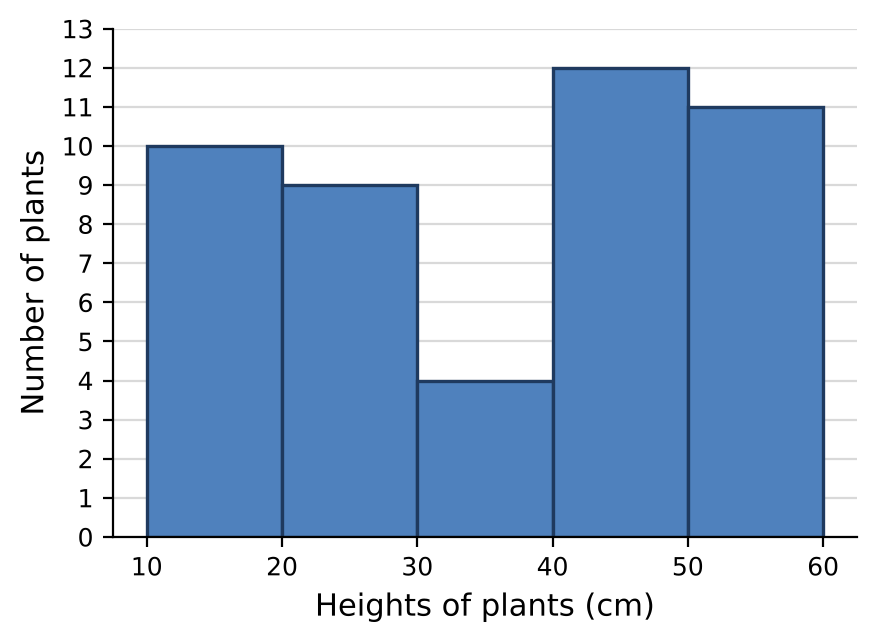
- At least 30 starts with the bar 30–40.
- Add that bar and every bar to its right.
- So 4 + 12 + 11 = 27.
- A (4): used only one bar
- B (16): left out the last bar: 4 + 12 = 16
- C (19): counted the bars below
- D (23): started one bar too late
Stem-and-leaf plots
Method. Count the leaves after 64 in its row, then every leaf below that row.
Worked example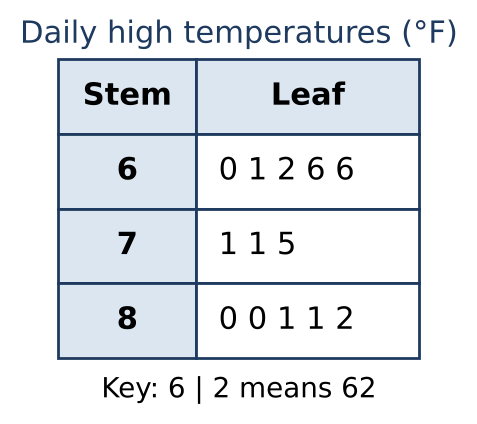
- In the row with stem 6, the leaves greater than 4 give 2 values.
- Every value in the rows below it is greater, adding 8 more.
- So there are 10 values.
- A (2): counted only the stem-6 values greater than 64 and left out the rows below: 2
- B (3): counted the values below
- C (5): counted only the row with stem 6
- D (8): counted only the rows below the one with stem 6
Two-way tables
Method. Add the two row totals; together they cover every cell.
Worked example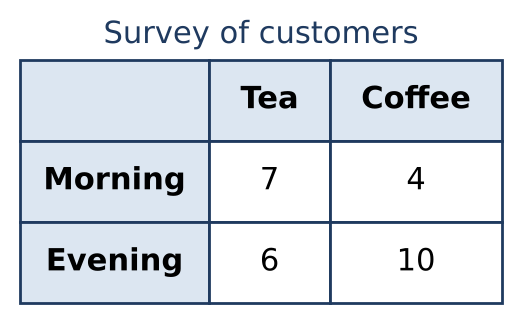
- Every customer is in exactly one cell.
- Add all four cells.
- So 7 + 4 + 6 + 10 = 27.
- A (11): added only the Morning row
- B (13): added only the Tea column
- C (16): added only the other row: 6 + 10 = 16
- E (37): made a carrying error of 10
Building data displays
Method. Tally each value into its interval; the bar height is the tally.
Worked example- Find the scores from 50 to 59, which are 50, 51, 52, 56, 58.
- That is 5 scores.
- So the bar is 5 tall.
- A (2): counted the next interval
- B (4): left out 50, the lower end of the interval: 51, 52, 56, 58 = 4
- D (6): also counted 60
- E (7): counted the values outside the interval
Probability
Probability is the number of favorable outcomes over the number of equally likely outcomes; it is between 0 and 1. Count outcomes by listing or by multiplying the choices at each step. The expected count is the probability times the number of trials.
Key formulas| Basic | |
| Range of values | |
| Complement | |
| Counting principle | |
| Two separate events | |
| Expected count |
Simple probability
Method. List the favorable outcomes and divide by the total number of outcomes.
Worked example- The favorable outcomes are 2, 4, 6, 8, which is 4 out of 8.
- So the probability is = .
- A (): counted only one outcome
- C (): counted 7 possible outcomes instead of 8:
- D (): counted one extra outcome
- E (1): divided by the outcomes that do not count
Experimental and theoretical probability
Method. Expected count = probability × number of trials.
Worked example- Multiply the probability by the number of trials.
- So × 40 = 16.
- A (): gave the probability, not a count
- B (8): found of 40 and did not multiply by 2: 40 ÷ 5 = 8
- D (20): divided the trials by the top number of the probability: 40 ÷ 2 = 20
- E (24): found the expected count of the other outcome
Sample spaces and counting
Method. Multiply the number of choices for each independent step.
Worked example- By the counting principle, multiply the number of choices.
- 3 × 4 × 2 = 24.
- A (9): added instead of multiplying
- B (12): left out one category
- C (14): added hats and pants, then multiplied by shirts: (3 + 4) × 2 = 14
- D (23): subtracted one
Compound events
Method. Independent “and” → multiply the probabilities.
Worked example- The two results are independent.
- So multiply.
- P(a 6) = and P(blue) = .
- So P(both) = × = .
- A (): counted only one combined outcome
- C (): used only the first event
- D (): used only the second event
- E (): added the probabilities