Data Analysis and Probability: Study Guide
The Upper Level SSAT (grades 8–11) has two 25-question Quantitative sections, 30 minutes each, with five answer choices and no calculator. A wrong answer loses ¼ point, so guess only after eliminating choices. This topic covers data and probability: mean, median, mode and range, reading tables and graphs, simple probability and counting.
Center and Spread
Mean, median and mode describe the center; the range describes the spread. An outlier pulls the mean toward it but barely moves the median. Adding the same number to every value shifts the center but does not change the range.
Key formulas| Mean | |
| Sum from the mean | |
| Median | |
| Median (even count) | |
| Mode | |
| Range | |
| Weighted mean | |
| Add k to every value |
Median
Method. Count to the middle dot (or the middle two) from the left.
Worked example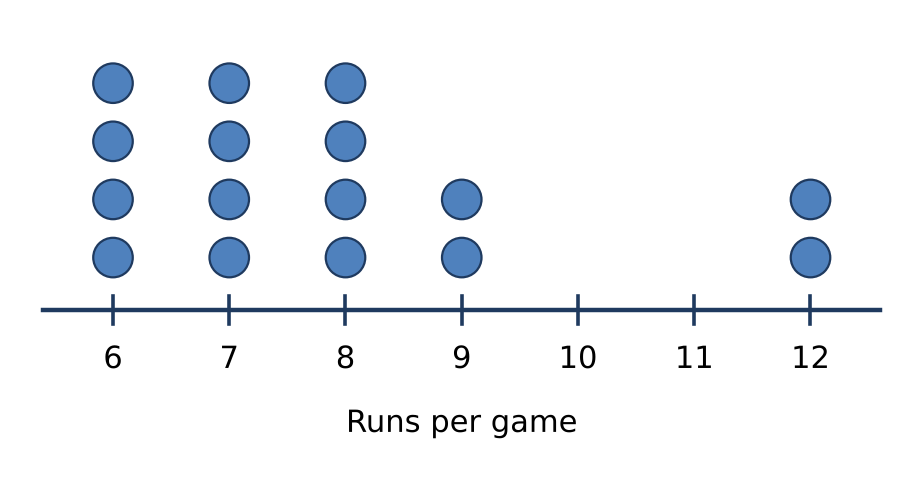
- There are 16 dots in all.
- The median is the mean of the values in positions 8 and 9, counting from the left.
- Those values are 7 and 8.
- So the median is (7 + 8) ÷ 2 = 7.5.
- A (7): gave the 8th value only instead of averaging the two middle values
- C (7.875): gave the mean
- D (8.5): gave the middle position instead of the value
- E (9): gave the middle of the number line
Mean
Method. Mean = sum of the values ÷ how many values there are.
Worked example- Add the values.
- So 14.2 + 12.5 + 11.9 + 8.4 = 47.
- Divide by the count, 4.
- So the mean is 47 ÷ 4 = 11.75.
- A (8.2): left out the greatest value but divided by the full count
- B (11.3): averaged only the greatest and least values
- D (12.2): found the median instead of the mean: (11.9 + 12.5) ÷ 2 = 12.2
- E (47): found the sum but did not divide
Comparing data sets
Method. Find the median of each set separately, then subtract.
Worked example- Ordered, A is 10, 26, 38, 43, 45.
- So its median is 38.
- Ordered, B is 15, 26, 27, 27, 34.
- So its median is 27.
- The difference is 38 − 27 = 11.
- A (6.6): compared the means instead
- C (12): took the middle value of B without ordering it: 38 − 26 = 12
- D (16): compared the ranges
- E (33): compared the sums
Missing value from a mean
Method. Needed score = target mean × new count − current total.
Worked example- For a mean of 74 over 5 tests, the total must be 74 × 5 = 370.
- The first 4 scores add to 287.
- So the next score must be 370 − 287 = 83.
- A (9): used the old number of tests
- B (71.75): gave the mean of the first 4 tests: 287 ÷ 4 = 71.75
- C (74): gave the target mean
- D (76.25): averaged the old mean and the new score
Effect of outliers
Method. Find both means, then subtract; an outlier pulls the mean toward it.
Worked example- The mean with every value is 145 ÷ 5 = 29.
- The outlier is 77.
- Without it, the mean is 68 ÷ 4 = 17.
- The decrease is 29 − 17 = 12.
- B (15.4): divided the outlier by the count
- C (17): gave the new mean
- D (29): gave the original mean
- E (48): gave the difference between the outlier and the original mean: 77 − 29 = 48
Weighted mean
Method. Combined mean = total of all scores ÷ total count, not the average of the two means.
Worked example- Total for the first class is 15 × 89 = 1335.
- Total for the second class is 12 × 62 = 744.
- The combined mean is (1335 + 744) ÷ 27 = 77.
- A (27): gave the total number of students, not the mean: 15 + 12 = 27
- B (74): matched each mean with the other group's size
- C (75.5): averaged the two means
- E (2079): gave the total, not the mean
Graphs and Tables
Read the title, axes, scale and units before reading values. Bar graphs compare categories, line graphs show change over time, circle graphs show parts of a whole, and histograms show how many values fall in each interval.
Key formulas| Percent of whole | |
| Circle graph angle | |
| Change |
Circle graphs
Method. Number = percent × total ÷ 100.
Worked example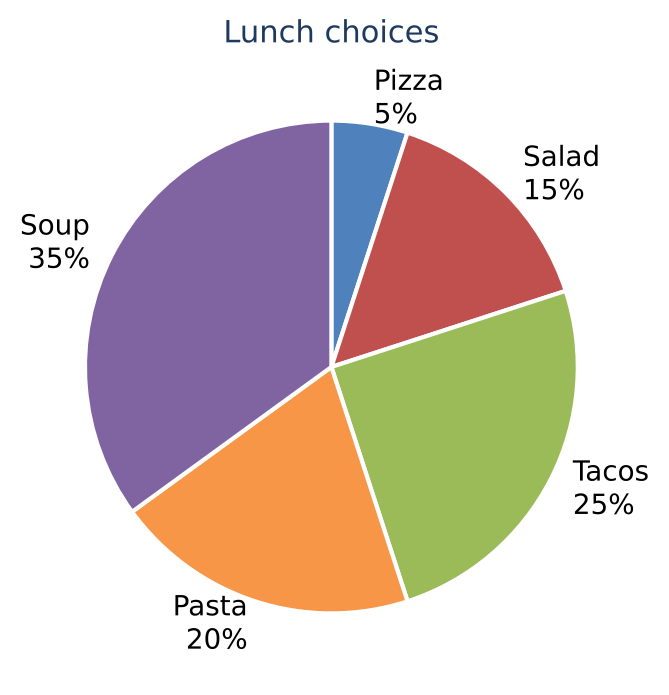
- Soup is 35% of the circle.
- Find 35% of 20.
- So × 20 = 7.
- A (1): used the percent for Pizza
- B (4): used the total, 20, as the percent: 20% of 20 = 4
- D (13): found the number not choosing Soup
- E (35): gave the percent instead of the number
Histograms
Method. Add the heights of the bars from 60 onward.
Worked example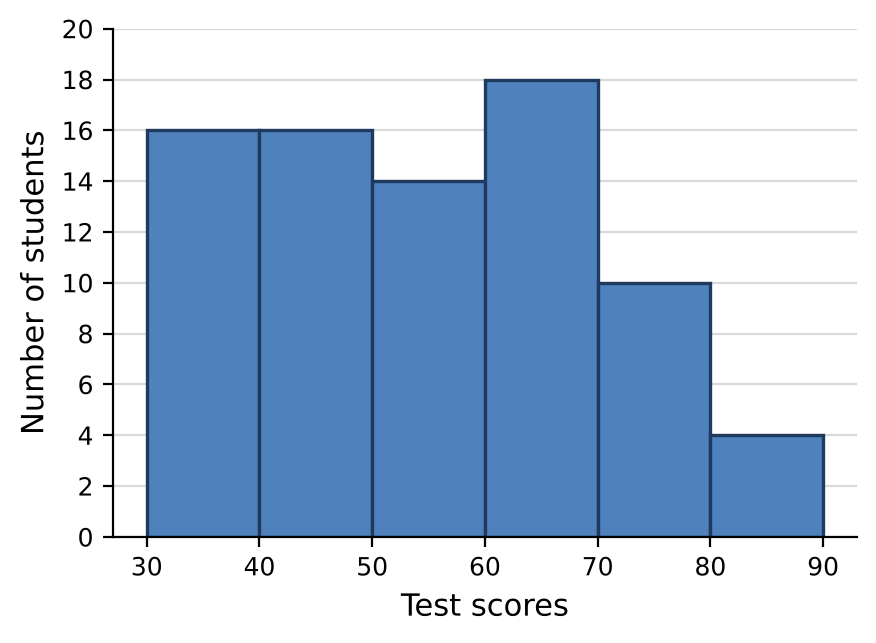
- At least 60 starts with the bar 60–70.
- Add that bar and every bar to its right.
- So 18 + 10 + 4 = 32.
- A (18): used only one bar
- C (46): counted the bars below
- D (64): confused 'at least 60' with 'below 70': 46 + 18 = 64
- E (78): counted every bar
Building data displays
Method. Angle = (part ÷ total) × 360°.
Worked example- The total is 12 + 34 + 18 + 16 = 80.
- Class B is of the data.
- The angle is × 360° = 153°.
- A (34): gave the count
- B (42.5): found the percent instead of the angle: = 42.5%
- C (90): split the circle equally: 360 ÷ 4 = 90
- E (326): subtracted the count from 360°: 360 − 34 = 326
Two-way tables
Method. Given a row → divide by that row's total.
Worked example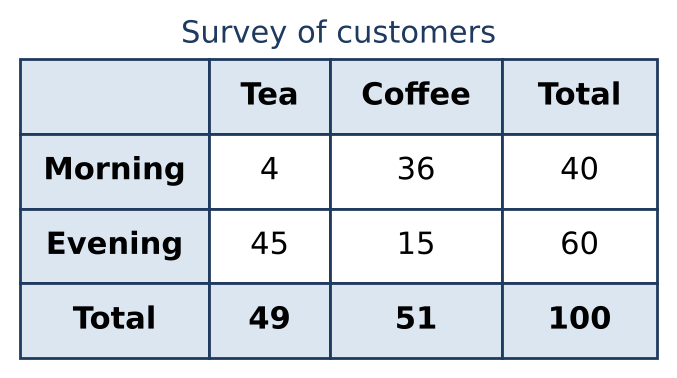
- The question is about the Morning row only.
- So divide by its total, 40.
- Then 4 ÷ 40 = = 10%.
- B (11%): divided the Tea cell by the Coffee cell instead of the row total: 4 ÷ 36 ≈ 11%
- C (40%): found the percent of all customers in the Morning row
- D (75%): used the Evening row
- E (90%): used the Coffee cell
Line graphs
Method. Percent change = (new − old) ÷ old × 100; always divide by the earlier year.
Worked example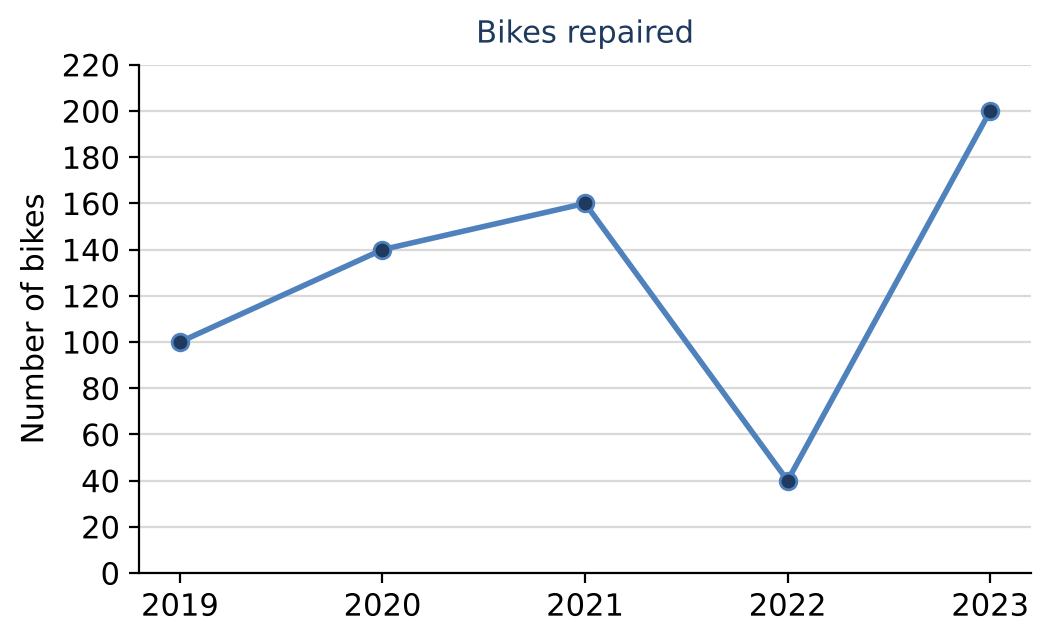
- Read the graph.
- So 2022 = 40 and 2023 = 200.
- The change is 160.
- Percent increase = change ÷ original × 100 = 160 ÷ 40 × 100 = 400%.
- A (4%): forgot to multiply by 100: 160 ÷ 40 = 4, written as 4%
- B (20%): gave the original value as a percent of the new value
- C (80%): divided by the new value instead of the original
- D (160%): gave the change, not the percent change
Misleading graphs
Method. Read values on the scale; a cut axis makes the bars' heights misleading.
Worked example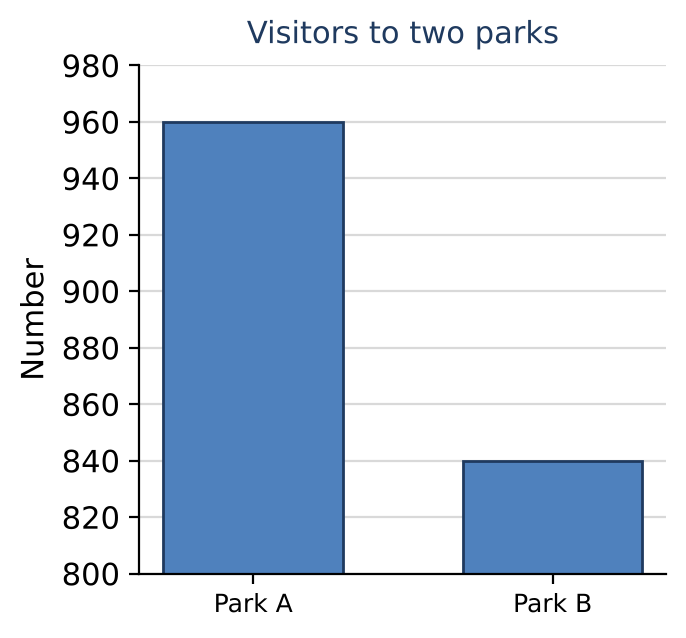
- Each bar's drawn height starts at 800.
- Park A's bar is 960 − 800 = 160 tall and Park B's is 840 − 800 = 40 tall.
- So it looks 160 ÷ 40 = 4 times as tall.
- A (): subtracted the starting value from one bar only
- B (): inverted the ratio
- C (): used the actual values instead of the bar heights
- D (3): gave how many times taller instead of how many times as tall: (160 − 40) ÷ 40 = 3
Probability
Probability is favorable outcomes over equally likely total outcomes. For a conditional probability, restrict to the given row or column of a table. The expected count is the probability times the number of trials.
Key formulas| Basic | |
| Complement | |
| Addition | |
| Independent | |
| Conditional | |
| Expected count |
Compound events
Method. Without replacement, reduce both the favorable count and the total for the second draw.
Worked example- First draw: P(yellow) = .
- After removing one yellow marble, 3 yellow remain out of 9.
- So P(both) = × = = .
- A (): counted yellow pairs as unordered but all pairs as ordered: =
- B (): did not reduce the total
- D (): replaced the first marble
- E (): did not reduce the number of yellow marbles
Sample spaces and counting
Method. Multiply the number of choices for each independent step.
Worked example- By the counting principle, multiply the number of choices.
- 4 × 3 × 3 = 36.
- A (10): added instead of multiplying
- B (12): left out one category
- C (15): multiplied two of the numbers and added the third: 4 × 3 + 3 = 15
- D (35): subtracted one
Conditional probability and two-way tables
Method. “Given” or “from those in” → divide by that group's total; “and” → one cell ÷ grand total.
Worked example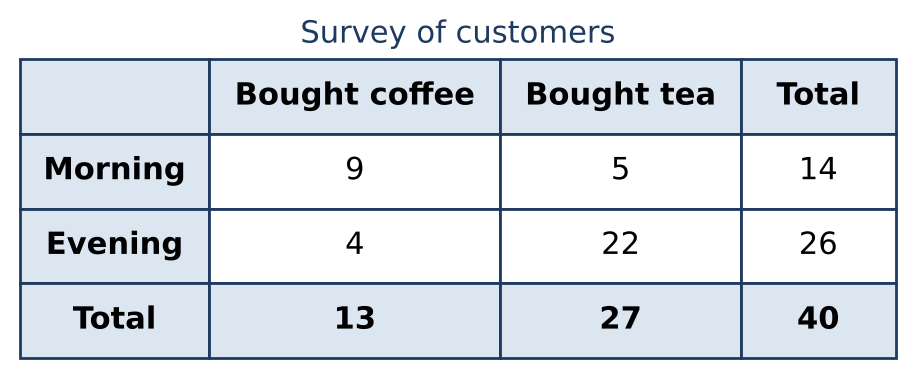
- Only the Bought coffee column counts.
- So the total is 13.
- Of these, 9 are in the Morning row.
- So the probability is .
- A (): divided by the grand total
- B (): found P(Bought coffee) instead
- C (): found P(Morning) instead: =
- D (): divided by the Morning row total
Expected counts
Method. Expected count = probability × number of spins.
Worked example- P(yellow) = .
- Multiply by the number of spins.
- So × 360 = 126.
- A (): gave the probability, not the count
- B (90): found the expected count for blue instead of yellow: × 360 = 90
- C (120): treated the three colors as equally likely
- E (234): found the expected number of non-yellow results
Complement rule
Method. P(at least one) = 1 − P(none).
Worked example- “At least one” is the complement of “none”.
- P(none) = = = .
- So P(at least one) = 1 − = .
- A (): found the probability that all succeed
- C (): multiplied the probability by the number of tries
- D (): found the probability that none succeed
- E (): subtracted the probability that both sprout from 1: 1 − =
Counting
Multiply choices for each stage. Use permutations when order matters and combinations when it does not.
Key formulas| Counting principle | |
| Factorial | |
| Permutations | |
| Combinations |
Counting principle
Method. Multiply the number of choices for each independent step.
Worked example- There are 26 choices for each letter and 10 for each digit.
- By the counting principle, × = 676 × 100 = 67,600.
- A (72): added the choices instead of multiplying: 26 + 26 + 10 + 10 = 72
- B (58,500): did not allow repeats: 26 × 25 × 10 × 9 = 58,500
- D (456,976): used 26 choices for every position: = 456,976
- E (1,679,616): let every position be a letter or a digit: = 1,679,616
Sample spaces and tree diagrams
Method. Each coin doubles the outcomes; exactly k heads → choose which coins.
Worked example- An outcome with exactly 3 heads is fixed by choosing which 3 of the 6 coins show heads.
- That is C(6, 3) = 20.
- A (3): gave the number of heads
- C (40): divided by 3 instead of 3!: 120 ÷ 3 = 40
- D (64): counted every outcome
- E (120): counted orders of the heads as different